Problem Set 3
Due by 11:59 PM Sunday, November 8, 2020 by PDF upload in Blackboard Assignments
Please type your answers to the following questions in a document and save as a PDFIn MS Word, or Pages, or most word processing software, File -> Save As -> PDF, or File -> Export -> PDF.
to upload on Blackboard under Assignments. You may handwrite answers if you will be able to scan/photograph & convert them to a single PDF, if they are easily readable, but this is not preferred. See my guide to making a PDF - an essential skill in the modern world. If you are handwriting answers, you may print the pdf above and write on it, or just write on a piece of paper (we only need your answers).
For the few questions that ask you to draw a graph, try to do so on your computer (use MS Paint, the drawing tools in MS Word or MS Powerpoint, plot points in MS Excel, drawing/notetaking apps, etc.), and save it as an image to include on your homework document. Again, they need not be perfect or to scale, just show that you understand the broad idea. Being able to understand and sketch the graphs is still a very important and useful skill! If all else fails, I will be lenient in grading graph questions if you are unable to technologically include a graph.
You may work together (and I highly encourage that) but you must turn in your own answers. I grade homeworks 70% for completion, and for the remaining 30%, and one question will be graded for accuracy - so it is best that you try every problem, even if you are unsure how to complete it accurately.
Concepts and Critical Thinking
Question 1
Under what circumstances can a tariff lead to an increase in overall national welfare? How likely do you expect this benefit to play out in practice, and why?
Question 2
What are the similarities and/or differences between a country imposing an import tariff or imposing an equivalent import quota that leads to the same amount of imports as under the tariff? Why might a country favor one over the other?
Question 3
Explain the “infant industries” argument for protectionism. What are some responses to the argument?
Question 4
Explain the “increasing returns” argument for protectionism. What are some responses to the argument?
Question 5
Why do governments adopt inefficient trade policies that, on net, reduce welfare? Explain the incentives of various groups in a democracy, and explain the principle of concentrated benefits and diffuse costs.
Problems
Please answer the following questions. Show all of your work and be sure to fully label all axes, points, and curves on any graphs (if applicable).
Question 6
Suppose car parts can be bought and sold on the world market at a price of $5,000, and fully-assembled cars can be bought and sold on the world market for $20,000.
Part A
Suppose the U.S. imports car parts, assembles them, and sells the cars at the world price. What is the domestic value added by the assembly industry?
Part B
Suppose the U.S. wants to protect its car assembly industry and levies a 25% tariff on imported cars (fully assembled). What is the nominal rate of protection for the U.S. car assembly industry? What is the effective rate of protection?
Part C
Suppose instead, the U.S. wants to protect its domestic parts manufacturing industry, and levies a 25% tariff on car parts (and cars are sold again at the original world price). What is the nominal rate of protection for the U.S. car parts manufacturing industry? What is the effective rate of protection?
Part D
What is the effective rate of protection for the U.S. car assembly industry under the tariff in Part C?
Question 7
The graph below shows the coffee bean market in Luxembourg. For simplicity, assume Luxembourg is a small country. You can work on this graph, or make your own to scale.
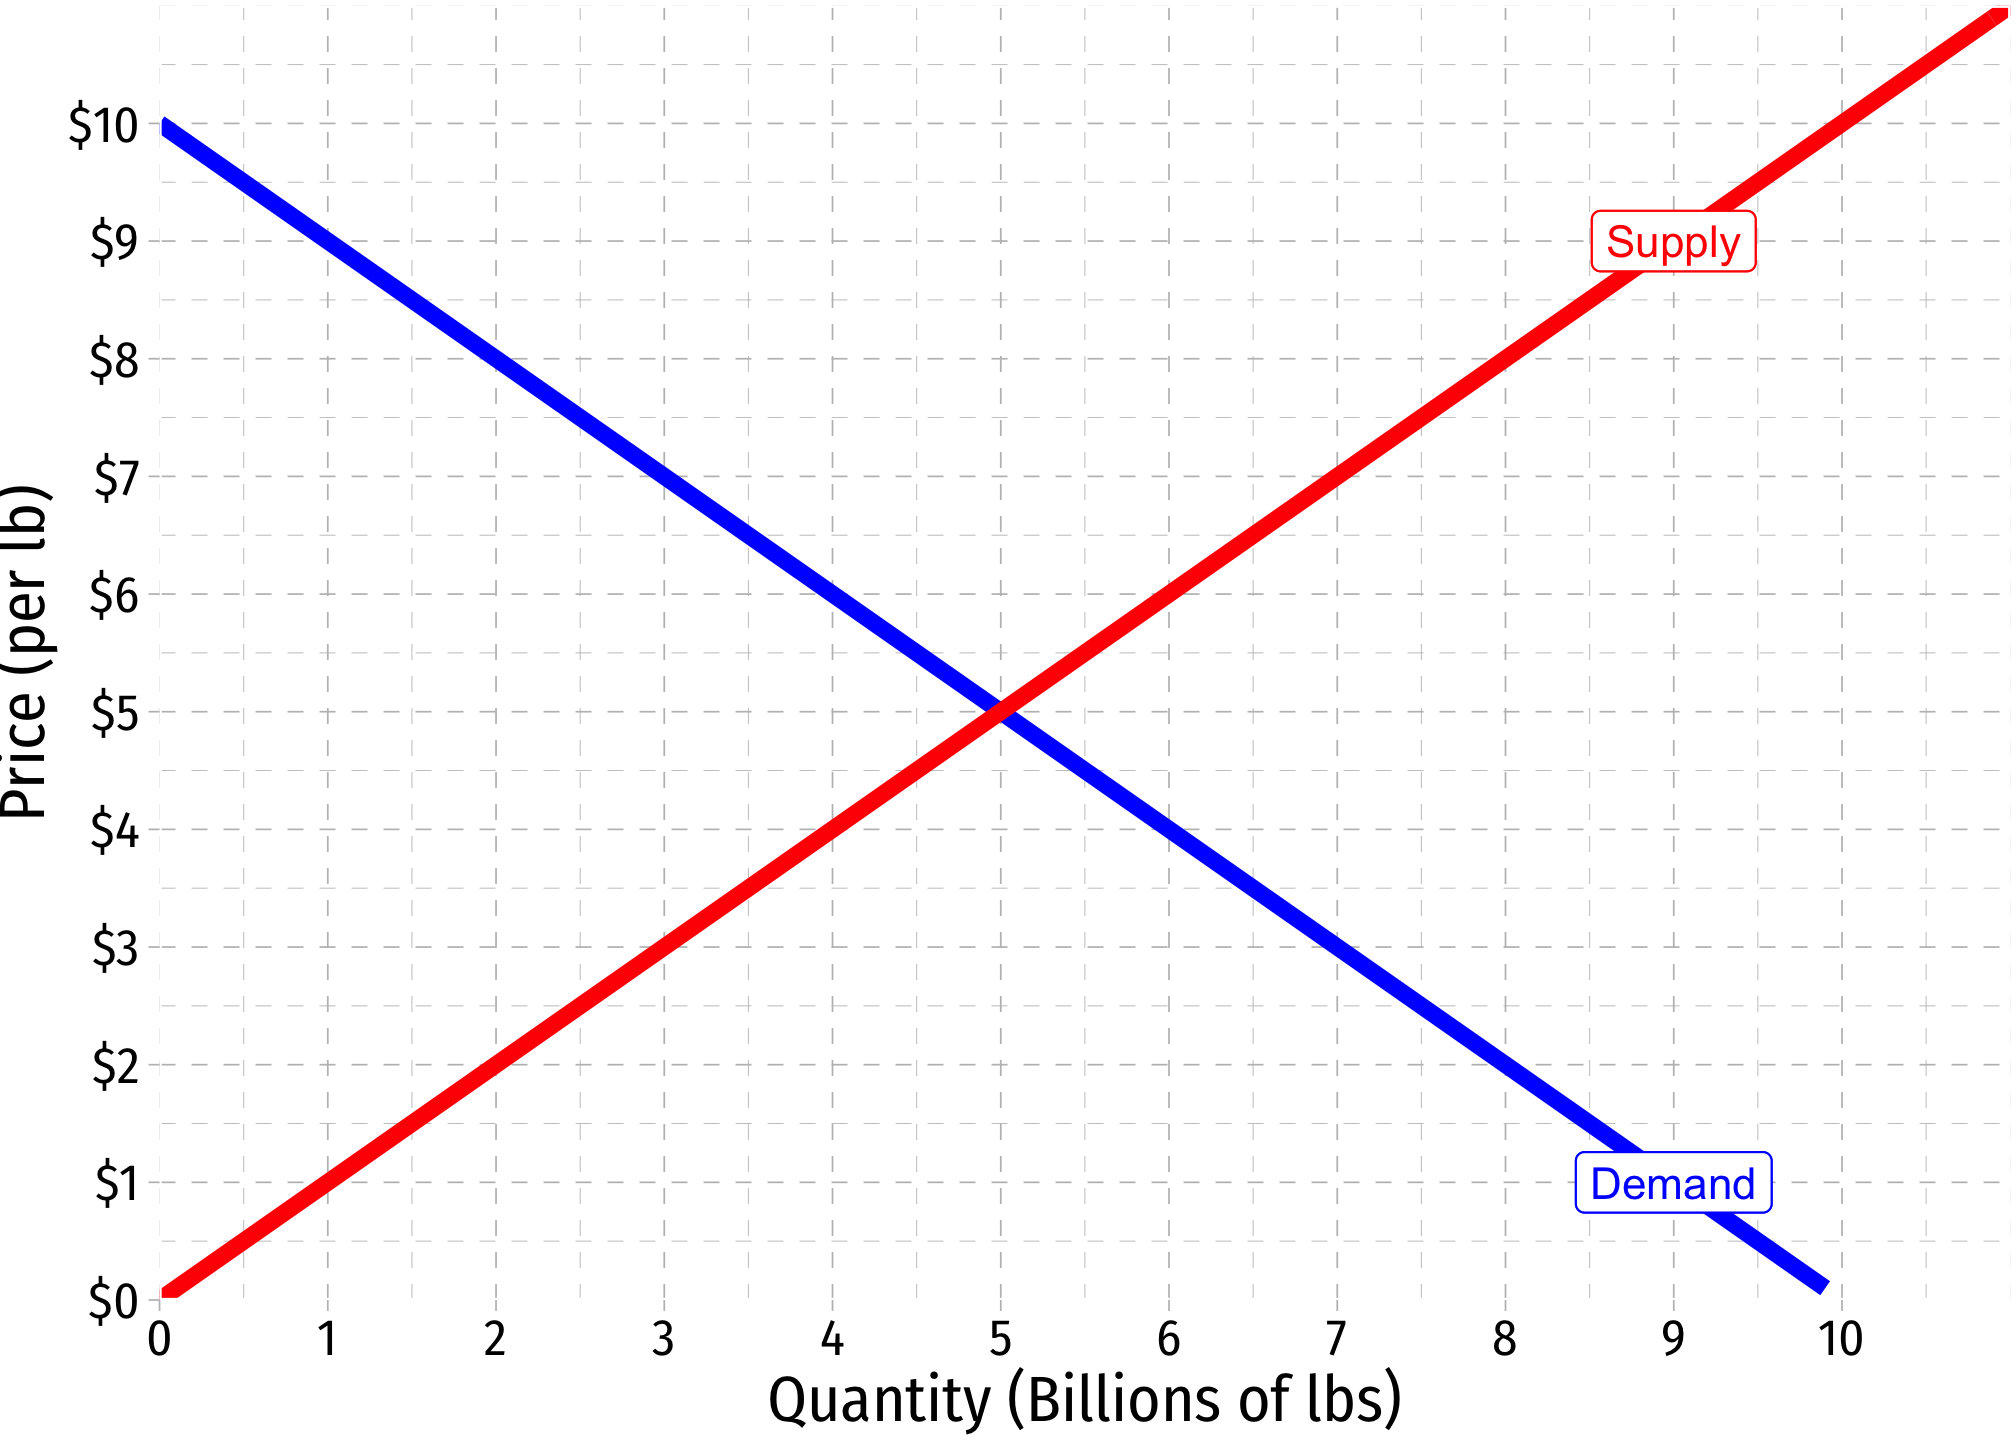
Part A
If there were no international trade, what would the price and quantity of coffee beans be in Luxembourg?
Part B
Suppose the world price of coffee beans is $2/lb. Draw this on the graph. With international trade, what is the price of coffee beans in Luxembourg?
Part C
Under free trade, how many pounds of coffee beans (i) does the total world (including Luxembourg) supply to Luxembourg’s consumers? (ii) do Luxembourg’s coffee producers supply to Luxembourg”s consumers? (iii) are imported?
Part D
Calculate the (i) consumer surplus of Luxembourg’s consumers and (ii) the producer surplus for Luxembourg coffee producers under international trade, and show these on the graph.
Part E
Suppose Luxembourg’s coffee bean producers are able to get the government to levy a $2/lb tariff on imported coffee beans. Draw this on the graph.
Part F
Under the new tariff, how many pounds of coffee beans (i) does the total world (including Luxembourg) supply to Luxembourg’s consumers? (ii) do Luxembourg’s coffee producers supply to Luxembourg’s consumers? (iii) are imported?
Part G
Calculate the (i) consumer surplus of Luxembourg’s consumers, (ii) the producer surplus for Luxembourg coffee bean producers, (iii) the government revenue raised from the tariff, (iv) the deadweight losses, and show these on the graph.
Part H
Domestically, who benefits and who loses under the tariff?
Part I
How high would the tariff need to be to stop all imports to Luxembourg?
Part J
Suppose the government of Luxembourg did not want to make its restrictions on trade as obvious as a tax, and instead decided to impose a quota on imports. What quota on imports would yield the same effects as the tariff you analyzed above? What are the primary differences between the results of a quota and the results of a tariff?
Question 8
The graph below shows the corn market in Mexico. For simplicity, assume Mexico is a small country. You can work on this graph, or make your own to scale.
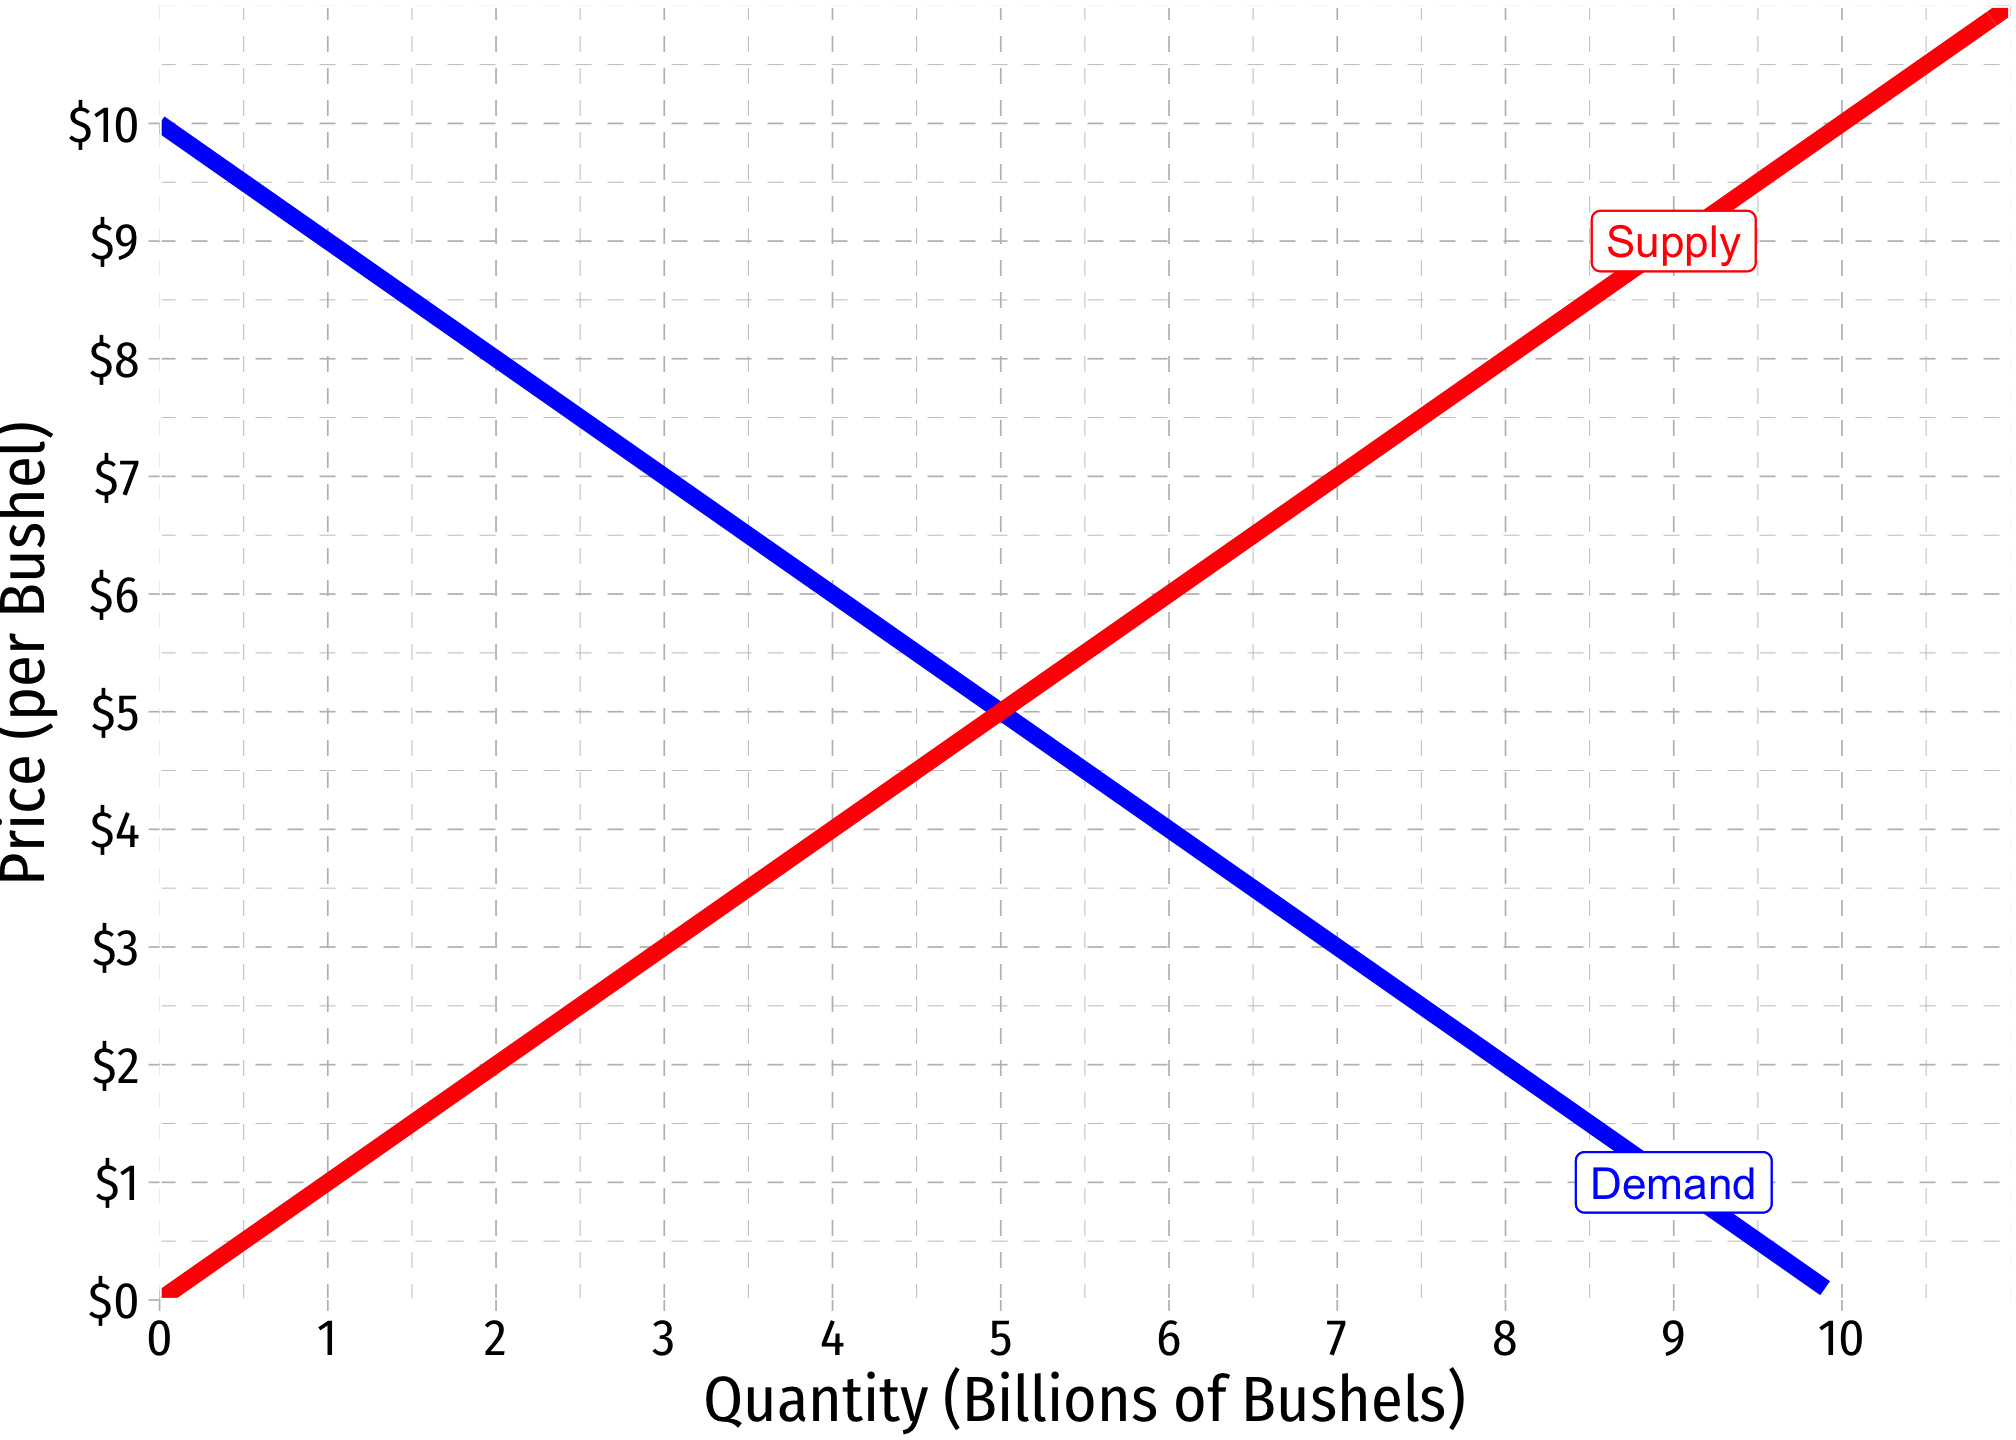
Part A
If there were no international trade, what would the price and quantity of corn be in Mexico?
Part B
Suppose the world price of corn is $6/bushel. Draw this on the graph. With international trade, what is the price of corn in Mexico?
Part C
Under free trade, how many bushels of corn (i) does the total world (including Mexico) consume? (ii) does Mexican consumers consume? (iii) are exported?
Part D
Calculate the (i) consumer surplus of Mexican consumers and (ii) the producer surplus of Mexican corn producers under international trade, and show these on the graph.
Part E
Suppose the Mexican government announces an export subsidy of $2/bushel of exported corn. Draw this on the graph.
Part F
Under the export subsidy, how many bushels of corn (i) does the total world (including Mexico) consume? (ii) does Mexico consume? (iii) are exported?
Part G
Calculate the (i) consumer surplus of Mexican consumers, (ii) the producer surplus of Mexican corn producers, (iii) the government spending on the subsidy, (iv) the deadweight loss, and show these on the graph.
Part H
Domestically, who benefits and who loses under the export subsidy?