1.6 — The Standard Trade Model
ECON 324 • International Trade • Fall 2020
Ryan Safner
Assistant Professor of Economics
safner@hood.edu
ryansafner/tradeF20
tradeF20.classes.ryansafner.com
From Ricardian to Neoclassical Model
The Standard Trade Model
The standard (or neoclassical) trade model is a more general model
- Ricardian one-factor model: special case
- Same with H-O (next) model
We will extend the concepts we learned from the Ricardian model
- more traditional neoclassical assumptions
A straightfoward neoclassical story about relative prices changing

What We're Adding to Ricardo

Money prices (in dollars), px, py
Other factors of production with diminishing returns
- Increasing opportunity costs of production
Determination of global equilibrium relative prices via supply & demand
Effects of the terms of trade changing
Effects of countries' economies development & trade policy
Tools for the Standard Model
We will do everything with graphs rather than equations
- I expect you to understand and be able to interpret, if not be able to draw own graphs
I will break today up into separate tools we will then combine
- PPF with increasing costs
- Indifference curves
- Comparative advantage in autarky
- Global market relative demand and relative supply
- International trade equilibrium
- Terms of trade changes (next class)

PPF: Increasing Costs
Factors of Production I
q=Af(t,l,k)
- Economists typically classify inputs, known as factors of production (FOP):
| Factor | Owned By | Earns |
|---|---|---|
| Land (t) | Landowners | Rent |
| Labor (l) | Laborers | Wages |
| Capital (k) | Capitalists | Interest |
- A: "total factor productivity" (ideas/knowledge/institutions)
- and Entrepreneurs/Owners who earn Profit

Factors of Production II
q=f(l,k)
- We often assume just two inputs: labor l and capital k
| Factor | Owned By | Earns |
|---|---|---|
| Labor (l) | Laborers | Wages |
| Capital (k) | Capitalists | Interest |

Marginal Product of Labor
Marginal product of labor (MPl): additional output produced by adding one more unit of labor (holding k constant) MPl=ΔqΔl
MPl is slope of TP at each value of l!
Note: via calculus: ∂q∂l


Marginal Product of Capital
Marginal product of capital (MPk): additional output produced by adding one more unit of capital (holding l constant) MPk=ΔqΔk
MPk is slope of TP at each value of k!
Note: via calculus: ∂q∂k


Diminishing Returns
Law of Diminishing Returns: adding more of one factor of production holding all others constant will result in successively lower increases in output
In order to increase output, need to increase use of all factors!


Diminishing Returns
Law of Diminishing Returns: adding more of one factor of production holding all others constant will result in successively lower increases in output
In order to increase output, need to increase use of all factors!


Competitive Markets and Factor Switching
We still assume output markets and factor markets (for land, labor, capital) are perfectly competitive
Firms hire resources up to the point where marginal cost of one more unit of l or k is equal to its marginal benefit in production ("marginal revenue product")
Implies that in equilibrium, each factor of production is paid its marginal revenue product: pl=py∗MPlpk=py∗MPk
- Where pl and pk are prices of labor and capital, and py is the price of some output
If you want to remember why, see my slides on Factor Markets
Multiple combinations of l and k can produce equivalent output y
Takeaway: producers will substitute between labor and capital depending on relative prices and technology
PPF: Increasing Costs
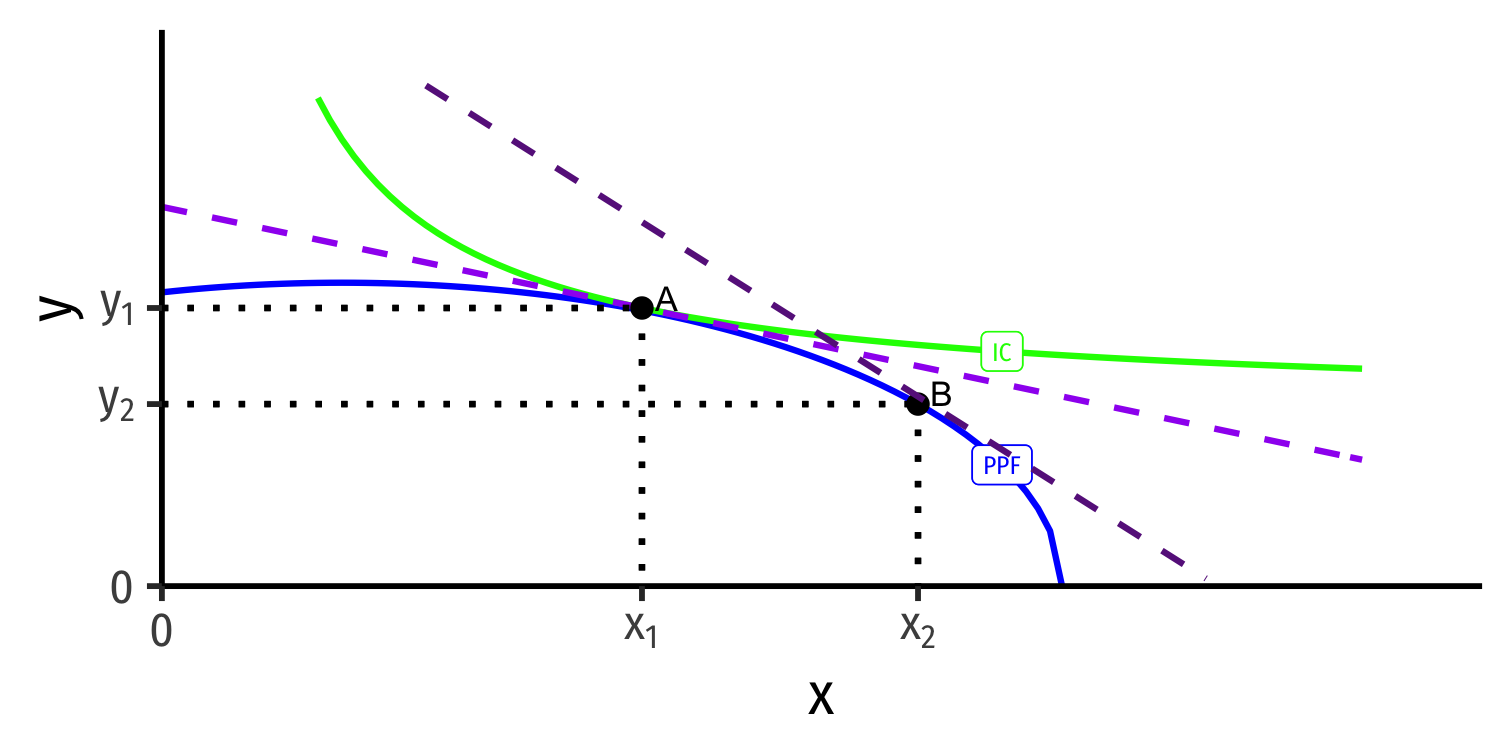
- Marginal rate of transformation (MRT) increases as we produce more of a good
- Again: “slope”, “relative price of x”, “opportunity cost of x”
- Amount of y given up to get 1 more x
−pxpy

PPF: Increasing Costs
- Marginal rate of transformation (MRT) increases as we produce more of a good
- Again: “slope”, “relative price of x”, “opportunity cost of x”
- Amount of y given up to get 1 more x
−pxpy

PPF: Increasing Costs
- Marginal rate of transformation (MRT) increases as we produce more of a good
- Again: “slope”, “relative price of x”, “opportunity cost of x”
- Amount of y given up to get 1 more x
−pxpy
- A→B raises opportunity cost of producing x

PPF: Increasing Costs
- Marginal rate of transformation (MRT) increases as we produce more of a good
- Again: “slope”, “relative price of x”, “opportunity cost of x”
- Amount of y given up to get 1 more x
−pxpy
A→B raises opportunity cost of producing x
A←B raises opportunity cost of producing y

What Causes a Curved PPF?
Diminishing returns to each factor of production (↓MPL,MPK,MPT) (holding others constant)
Substitution of factors of production and combinations based on relative factor prices
Moving Left/Right ⟹ changes in relative prices between x and y
(pxpy)1→(pxpy)2
- We dive deeper into these issues in the next model

Optimal Production Choice in Autarky
A country begins in autarky with no international trade
Where on its PPF should it produce? It should find an optimum combination of (x,y)
Every point on its PPF is determined by relative prices pxpy
- As a curve, each point has a different slope (derivative)

Optimal Production Choice in Autarky
- Assume: country will produce to maximize the market value of its production
Choose: < a production & consumption bundle >
In order to maximize: < market value >
Subject to: < technology and market prices >

Optimal Production Choice in Autarky
- For some given autarky prices, px and py:
pxx+pyy=V
- Describes the equation of "isovalue lines"
- Each line: set of combinations of x and y worth the same total market value
- Higher lines ⟹ higher market value

Optimal Production Choice in Autarky
- For some given autarky prices, px and py:
pxx+pyy=V
Describes the equation of "isovalue lines"
- Each line: set of combinations of x and y worth the same total market value
- Higher lines ⟹ higher market value
Solved for y to graph: y=Vpy−pxpyx

Optimal Production Choice in Autarky
y=Vpy−pxpyx
- Again, slope is the relative price of x

Optimal Production Choice in Autarky
y=Vpy−pxpyx
Again, slope is the relative price of x
Given px and py, pick the point on PPF tangent to highest line
Point A: maximized market value of output under current constraints

Isovalue Lines depend on Relative Prices in Autarky
y=Vpy−pxpyx
- If relative prices were to change (in autarky)
(pxpy)1→(pxpy)2
there would be a new set of isovalue lines with a different slope.

Isovalue Lines depend on Relative Prices in Autarky
y=Vpy−pxpyx
- If relative prices were to change (in autarky)
(pxpy)1→(pxpy)2
there would be a new set of isovalue lines with a different slope.
- Optimum in autarky would be different point tangent to highest isovalue line of new slope: Point B

Indifference Curves
Indifference Curves
- Consider a bundle of goods x and y: A = (2,5)

Indifference Curves
Consider a bundle of goods x and y: A = (2,5)
Consider another bundle: B = (5,2)
- More x but less y

Indifference Curves
Consider a bundle of goods x and y: A = (2,5)
Consider another bundle: B = (5,2)
- More x but less y
Consider a third bundle: C = (10,1)
- Even more x but even less y

Indifference Curves
Consider a bundle of goods x and y: A = (2,5)
Consider another bundle: B = (5,2)
- More x but less y
Consider a third bundle: C = (10,1)
- Even more x but even less y
Suppose you are indifferent between A∼B∼C: these bundles are on the same indifference curve

Indifference Curves
- Country is indifferent between all bundles on the same indifference curve

Indifference Curves
Country is indifferent between all bundles on the same indifference curve
Bundles above curve are preferred over bundles on curve
- D≻A∼B∼C
- On a higher curve

Indifference Curves
Country is indifferent between all bundles on the same indifference curve
Bundles above curve are preferred over bundles on curve
- D≻A∼B∼C
- On a higher curve
Bundles below curve are less preferred than bundles on curve
- E≺A∼B∼C
- On a lower curve

Marginal Rate of Substitution
- To aquire 1 more unit of x, how many units of y are you willing to give up to remain indifferent?

Marginal Rate of Substitution I
To aquire 1 more unit of x, how many units of y are you willing to give up to remain indifferent?
Marginal Rate of Substitution (MRS): rate at which you trade off one good for the other and remain indifferent
Again: opportunity cost: # of units of y you need to give up to acquire 1 more x

MRS vs. Other Slopes
Isovalue lines (slope) & MRT (PPF slope) measured the production tradeoff between x and y based on market prices
MRS measures consumption tradeoff between x vs. y based on preferences

Marginal Rate of Substitution
MRS is the slope of the indifference curve MRSx,y=−ΔyΔx=riserun
Amount of y given up for 1 more x
Note: slope (MRS) changes along the curve!

Autarky Optimum
Home's Autarky Optimum
- Home produces and consumes at highest indifference curve tangent to its PPF

Home's Autarky Optimum
Home produces and consumes at highest indifference curve tangent to its PPF
At Home's autarky optimum:
MRT⏟PPF Slope=MRS⏟I.C. Slope=(pxpy)⏟price line
- This is Home's relative price in autarky: the relative price (of x) where nation is maximizing its welfare in autarky

Foreign's Autarky Equilibrium
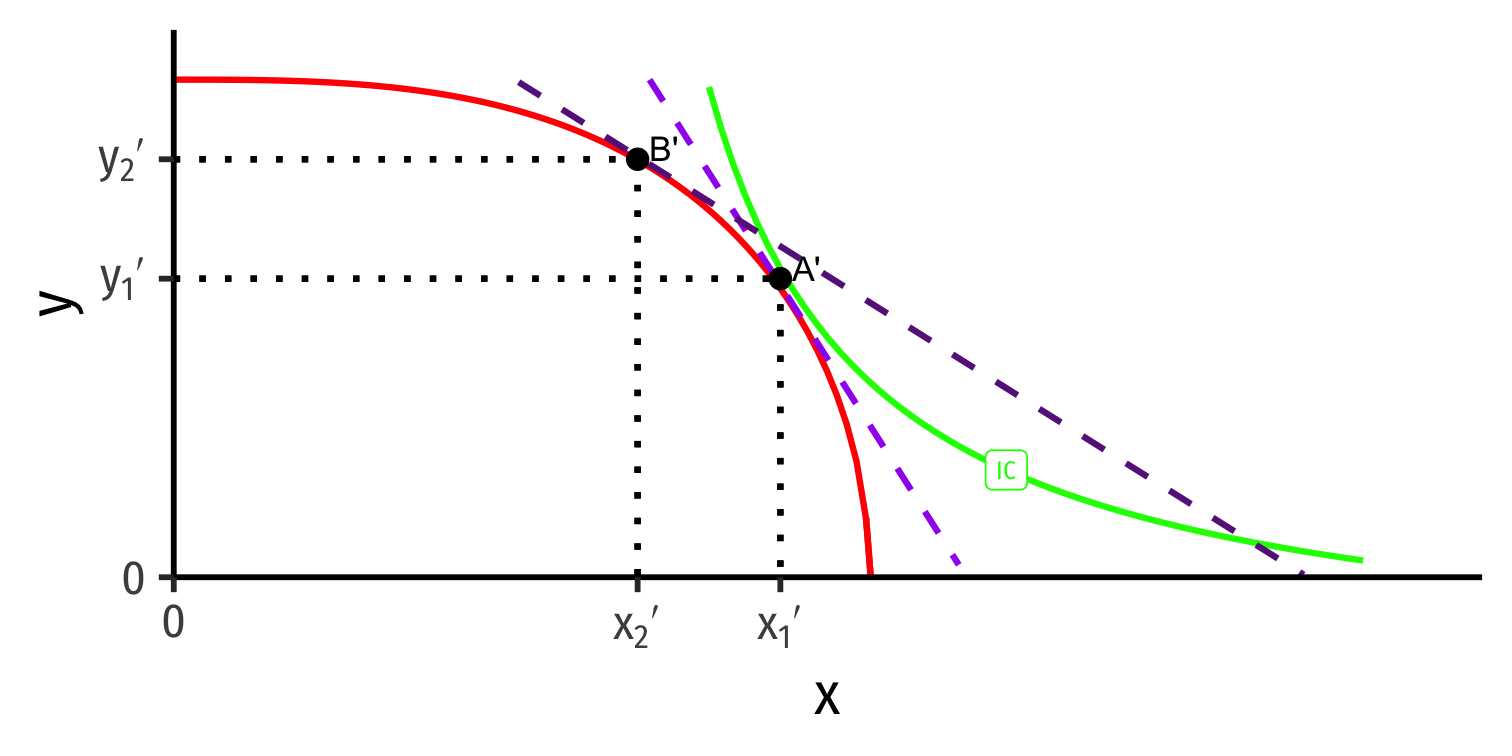
- Foreign (with different PPF) also produces and consumes at highest indifference curve tangent to its PPF

Foreign's Autarky Equilibrium
Foreign (with different PPF) also produces and consumes at highest indifference curve tangent to its PPF
At Foreign's autarky optimum:
MRT′⏟PPF Slope=MRS′⏟I.C. Slope=(pxpy)′⏟price line
- This is Foreign's relative price in autarky: the relative price (of x) where nation is maximizing its welfare in autarky

Relative Prices in Autarky Equilibrium
Home

Foreign

- Home and Foreign have different relative prices in autarky
Relative Prices in Autarky Equilibrium
Home

Foreign

Home and Foreign have different relative prices in autarky
Relative price of x (slope of PPF) is lower (flatter) in Home than Foreign
(pxpy)<(pxpy)′
Comparative Advantage
Home

Foreign

- Home has a comparative advantage in x; will export x
- Foreign has a comparative advantage in y; will export y
Recall from Ricardian Model: Price Adjustments
- Home exports x ⟹ less x sold in Home ⟹ ↑px in Home
Recall from Ricardian Model: Price Adjustments
Home exports x ⟹ less x sold in Home ⟹ ↑px in Home
As x arrives in Foreign ⟹ more x sold in Foreign ⟹ ↓px in Foreign
Recall from Ricardian Model: Price Adjustments
Home exports x ⟹ less x sold in Home ⟹ ↑px in Home
As x arrives in Foreign ⟹ more x sold in Foreign ⟹ ↓px in Foreign
Foreign exports y ⟹ less y sold in Foreign ⟹ ↑py in Foreign
Recall from Ricardian Model: Price Adjustments
Home exports x ⟹ less x sold in Home ⟹ ↑px in Home
As x arrives in Foreign ⟹ more x sold in Foreign ⟹ ↓px in Foreign
Foreign exports y ⟹ less y sold in Foreign ⟹ ↑py in Foreign
As y arrives in Home ⟹ more y sold in Home ⟹ ↓py in Home
Global Market for x
Global Market for x: Home
Home

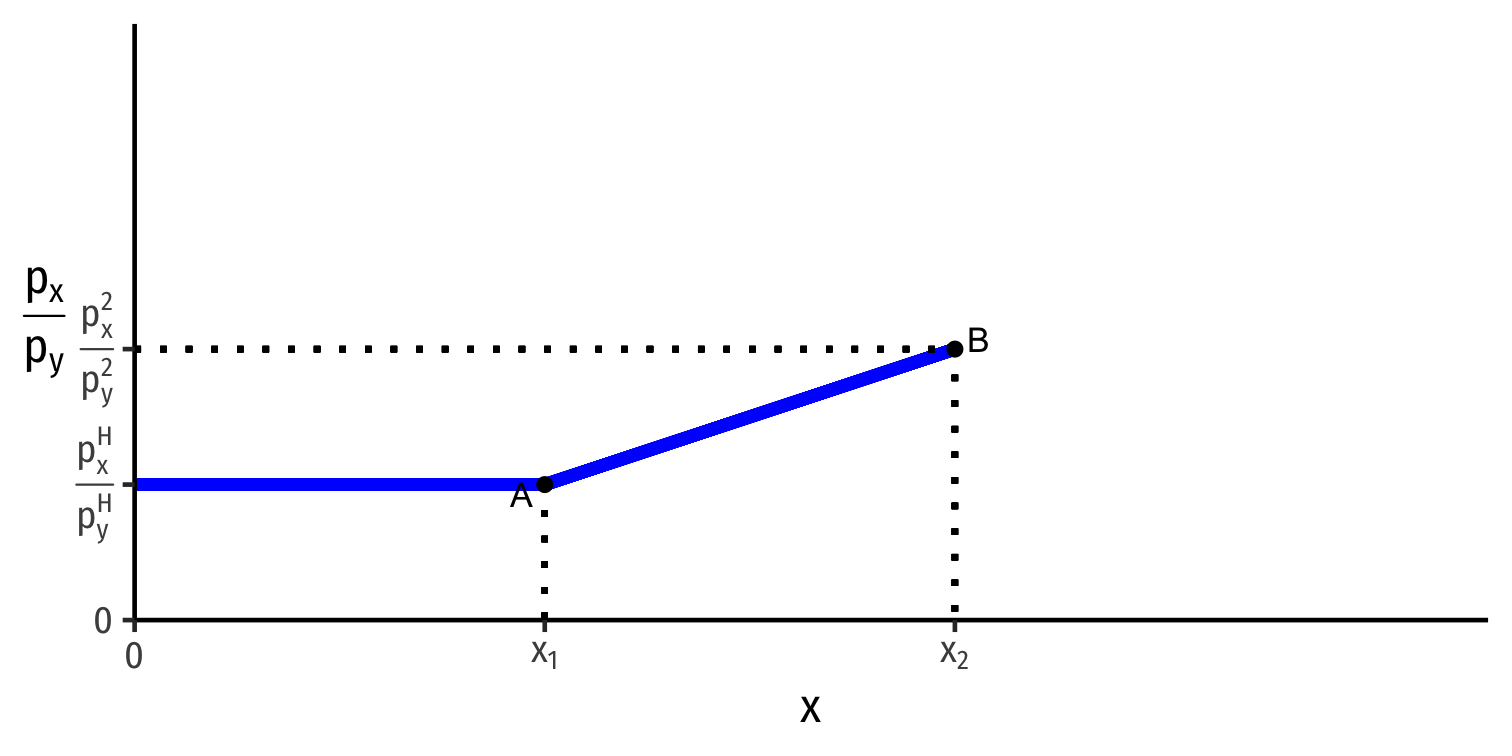
Home's Supply of x

- Home is exporting x
Global Market for x: Home
Home

Home's Export Supply of x

Home is exporting x
As relative price of x (slope) ↑ from (pxpy)H→(pxpy)2, Home exports more x
Global Market for x: Home
Home

Home's Export Supply of x

Home is exporting x
As relative price of x (slope) ↑ from (pxpy)H→(pxpy)2, Home exports more x
Trace Home's export supply curve for x upward as relative price of x increases
Global Market for x: Foreign
Foreign

Foreign's Import Demand for x

- Foreign is importing x
Global Market for x: Foreign
Foreign

Foreign's Import Demand for x

Foreign is exporting x
As relative price of x (slope) ↓ from (pxpy)F→(pxpy)2, Foreign imports more x
Global Market for x: Foreign
Foreign

Foreign's Import Demand for x

Foreign is exporting x
As relative price of x (slope) ↓ from (pxpy)F→(pxpy)2, Foreign imports more x
Trace Foreign's import demand curve for x upward as relative price of x decreases
The Global Market for x
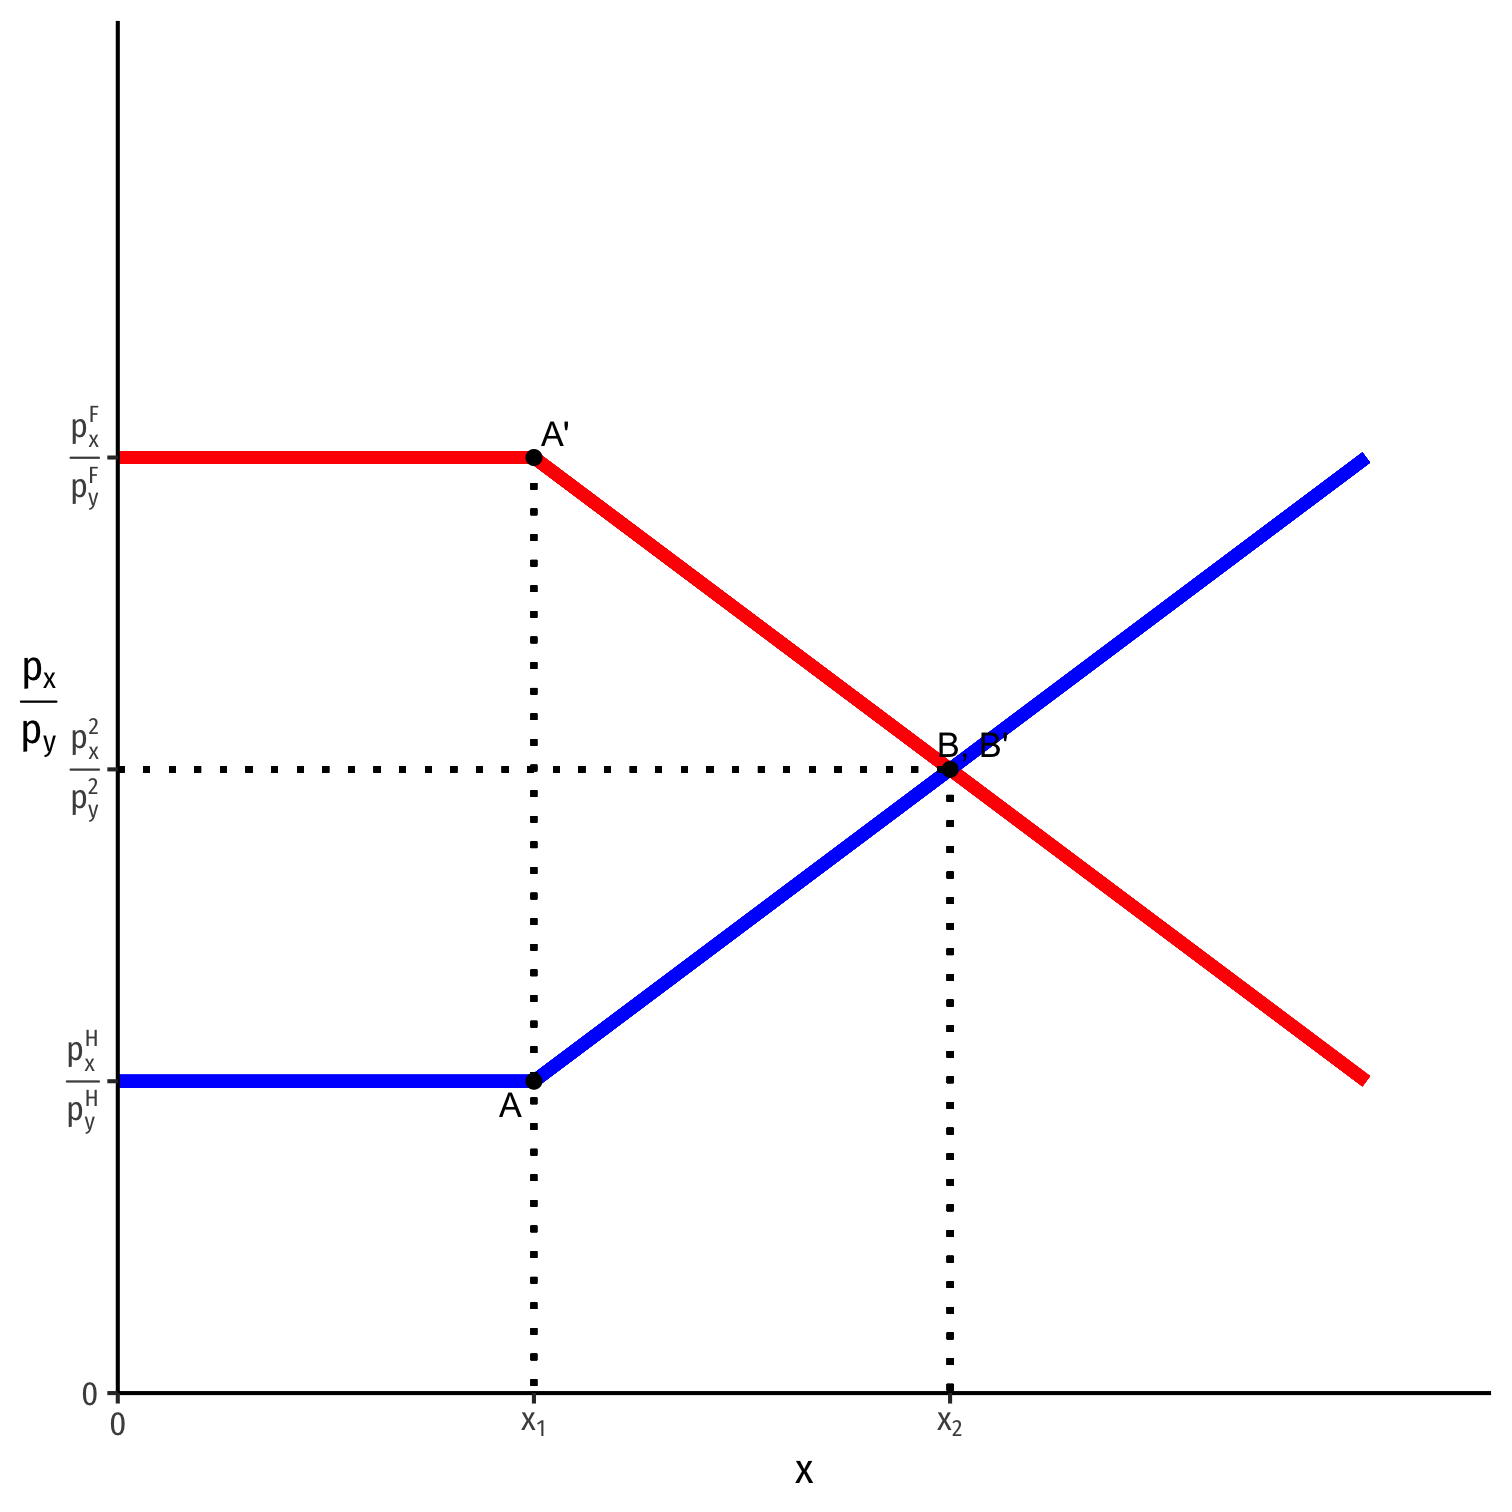
Put together Home's export supply and Foreign's import demand for x
World equilibrium relative price of x: (pxpy)2 balances Home's exports and Foreign's imports of x

The Global Market for x
- Both countries began in autarky (A, A') with very different relative prices of x
- Cheaper in Home (has comparative advantage)
- More expensive in Foreign (comparative disadvantage)

The Global Market for x
Both countries began in autarky (A, A') with very different relative prices of x
- Cheaper in Home (has comparative advantage)
- More expensive in Foreign (comparative disadvantage)
As countries trade, changes relative price of x in each country until both reach equilibrium world relative price (B,B'), where both countries have same relative price:
(pxpy)H<(pxpy)2<(pxpy)F

The Complete Picture
Autarky Equilibrium
Home

Foreign

- Countries begin in autarky optimum with different relative prices
- A is optimum for Home
- A' is optimum for Foreign
Specialization
Home

Foreign

International trade changes the relative price of x (↑ for Home, ↓ for Foreign)
With international trade, countries face same world relative prices (slope of dark purple dashed line)
Specialization
Home

Foreign

Countries specialize: produce more of comparative advantaged good, less of disadvantaged good
- Home: A → B: produces more x, less y
- Foreign: A' → B': produces less x, more y
Note this is incomplete specialization: countries still produce both goods!
Trade Triangles
Home

Foreign

- Home → x → Foreign
Trade Triangles
Home

Foreign

Home → x → Foreign
Home ← y ← Foreign
Gains from Trade
Home

Foreign

Both countries exchange their imports & exports and consume at C and C'
Both reach a higher indifference curve with trade, well beyond their PPFs!