1.9 — The Hecksher-Ohlin Model
ECON 324 • International Trade • Fall 2020
Ryan Safner
Assistant Professor of Economics
safner@hood.edu
ryansafner/tradeF20
tradeF20.classes.ryansafner.com
Motivations of the Hecksher-Ohlin Model
Extending/Applying the Standard Model
Explore (some of) the determinants of comparative advantage
- Standard model merely assumed comparative advantages via different relative prices across countries
- What causes countrues to start with do those different relative prices?
Explore effect that international trade has on earnings of factors in trading countries
- We did that with specific factors model
- Here we do that again with different assumptions
Motivations
Eli Hecksher was a Swedish economist
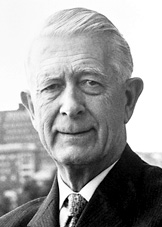
He & his student Bertil Ohlin developed a model to explain international trade
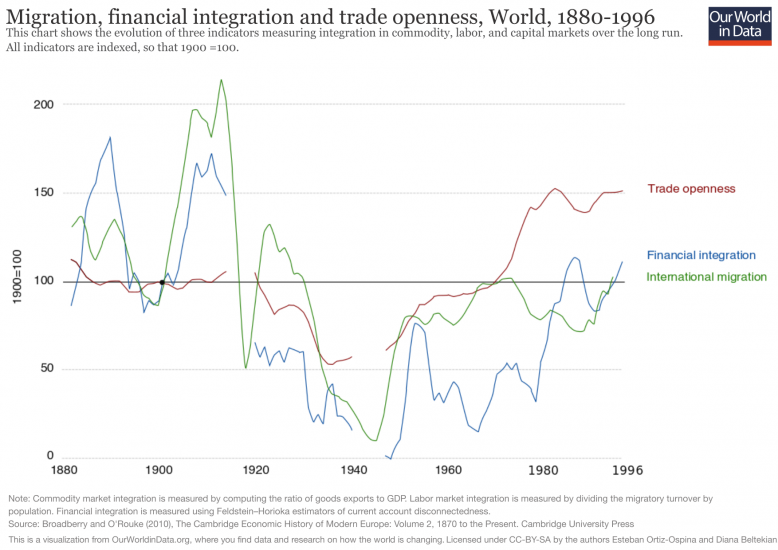
They were writing during the late 1910s, during the “golden age of international trade” before WWI
Wanted to explain the enormous burst of trade during their lifetimes
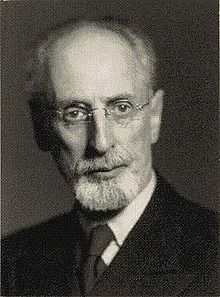
L: Eli Hecksher (1879-1952)
R: Bertil Ohlin (1899-1979)
The Second Industrial Revolution
“Second industrial revolution” c.1890-1914, especially in United States
Massive improvements & innovation in transportation & supply chains
- railroads, steamships, automobiles, electrification, refrigeration
Massive increase in international trade until WWI (1914)


Motivations
Unlike Ricardo: it’s not differences in technology/productivity across countries that cause trade
- can mimic and transfer!
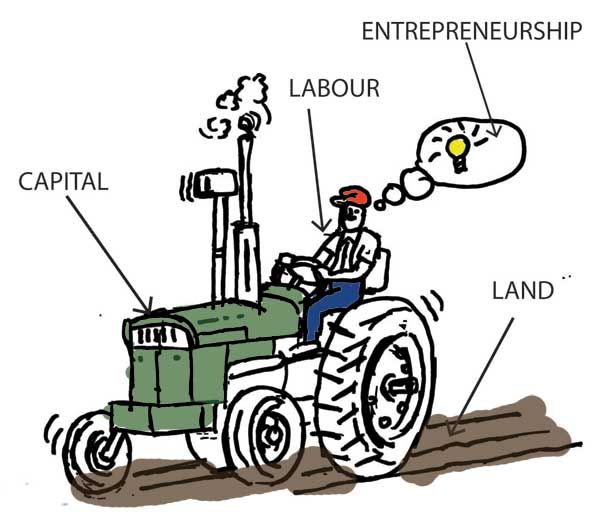
It’s the uneven distribution of resources, the factors of production: land, labor, capital


L: Eli Hecksher (1879-1952)
R: Bertil Ohlin (1899-1979)
Differences in Factor Endowments
 |
 |
 |
| Relatively land abundant | Relatively capital abundant | Relatively labor abundant |
| Exports timber, agricultural products | Exports services, sophisticated manuf. | Exports basic manuf. |
Hecksher-Ohlin Theory
Hecksher-Ohlin (H-O) Theory: focus on differences in relative abundance of factors of production across countries
- determines different relative prices and hence comparative advantage
H-O Theory is often expressed as the combination of several “theorems”...


L: Eli Hecksher (1879-1952)
R: Bertil Ohlin (1899-1979)
Hecksher-Ohlin Theorem
1) Hecksher-Ohlin (H-O) Theorem: a nation will export the good whose production requires the intensive use of the nation’s relatively abundant factor, and import the good whose production requires the intensive use of the nation’s relatively scarce factor


L: Eli Hecksher (1879-1952)
R: Bertil Ohlin (1899-1979)
Factor-Price Equalization Theorem
2) Factor Price Equalization (FPE) Theorem: under certain conditions, international trade tends to bring about equalization in relative and absolute returns to homogeneous factors across nations
3) Stolper-Samuelson Theorem: in the long run, an increase in the relative price of a good will increase the real earnings of the factor used intensively in that good’s production and decrease the earnings of the other factor


L: Eli Hecksher (1879-1952)
R: Bertil Ohlin (1899-1979)
Assumptions of the H-O Model
Assumptions of the H-O Model
Imagine 2 countries, Home and Foreign
Countries have two factors of production:
- labor (L)
- capital (K)
All factors of production are mobile (non-specific) within a country, but not internationally
Setting up an H-O Model Example
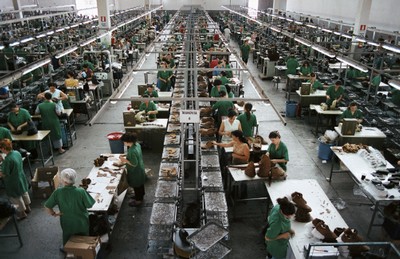
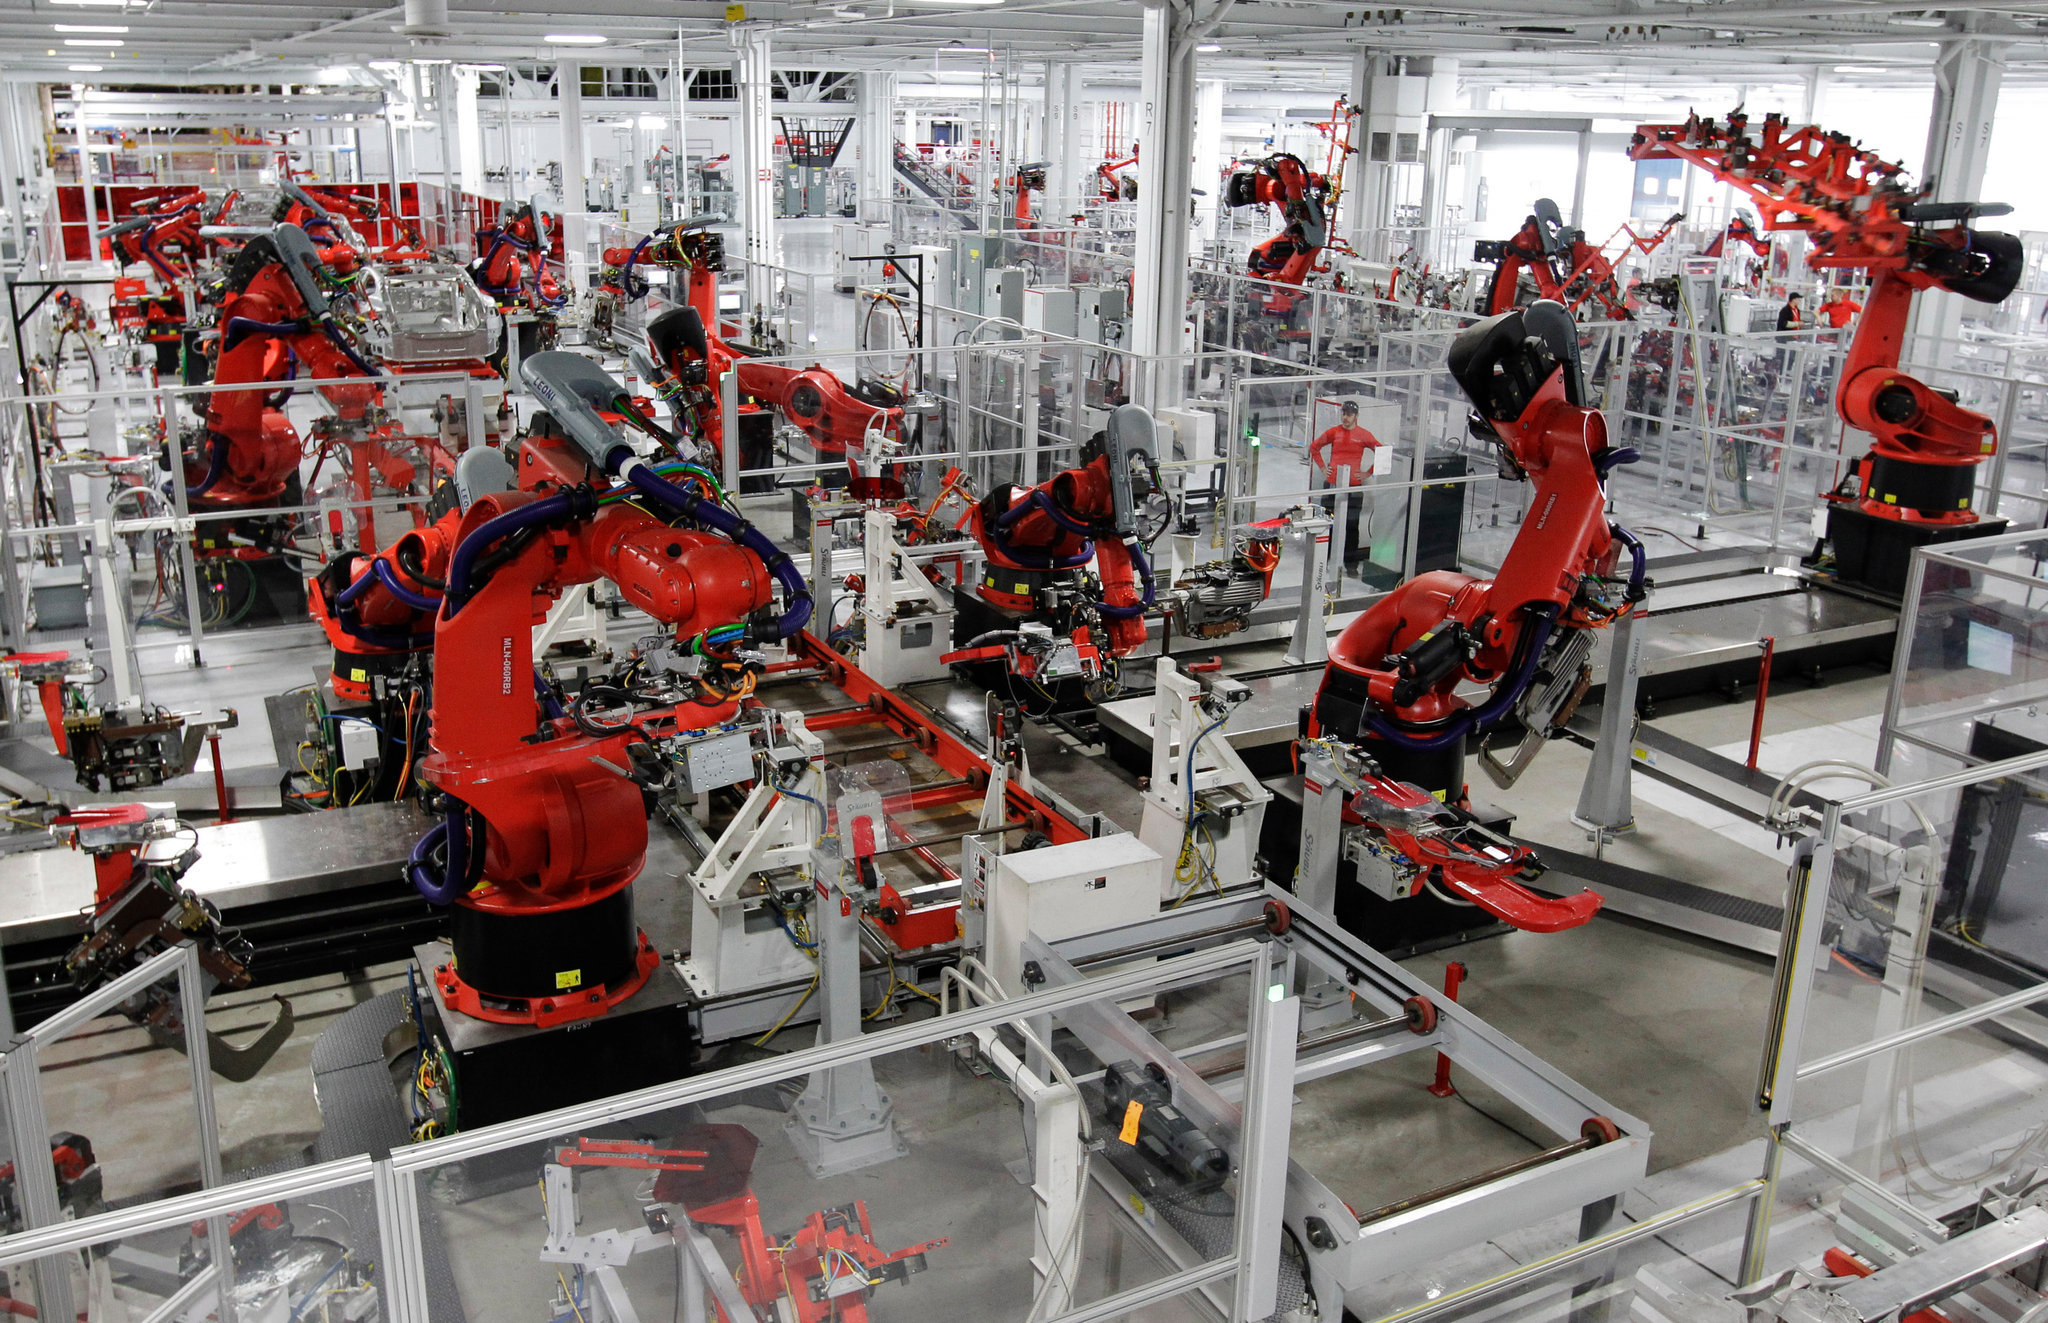
Each country has two industries, computers (c) and shoes (s)
Shoe production (s) is relatively labor-intensive, requiring a higher labor to capital ratio lk
Computer production (c) is relatively capital-intensive, requiring a lower labor to capital ratio lk
lckc<lsks


Setting up an H-O Model Example
Foreign is relatively labor-abundant, with a high labor to capital ratio, LK
Home is relatively capital-abundant, with a low labor to capital ratio, LK
LK<L′K′
A Few Simplifying Assumptions
Both factors are required to produce each good
Final products are traded freely
Technology is identical across countries
Consumer preferences are identical across countries and do not vary with income


L: Eli Hecksher (1879-1952)
R: Bertil Ohlin (1899-1979)
The Two Industries
Shoe production (s) is relatively labor-intensive good, requiring a higher labor to capital ratio lsks
Computer production (c) is relatively capital-intensive good, requiring a lower labor to capital ratio lckc
Key is relative factor intensity!
In absolute terms, computers could need more labor to make than shoes, but if computers require more capital per worker than shoes, they are relatively more capital-intensive (and vice versa)!


The Two Countries
Foreign is relatively labor-abundant, with a high labor to capital ratio, LK
Home is relatively capital-abundant, with a low labor to capital ratio, LK
Key is relative factor abundance!
In absolute terms, Home could have more labor than Foreign, but if Foreign has more labor per unit of capital than Home, Foreign is relatively more labor-abundant (and vice versa)!


Relative Factor Uses and Relative Factor Prices
Relative Factor Uses and Relative Factor Prices
Consider relative factor uses and relative factor prices
Note: I'll always do everything in terms of labor (labor-to-capital ratio lk and labor-to-capital return wr) for consistency
How much lk a country uses depends on the relative price of labor wr

Factor Uses and Relative Factor Prices
- A country's economy-wide relative demand for labor is an average of the lsks and lckc relative labor demand curves

Factor Uses and Relative Factor Prices
A country's economy-wide relative demand for labor is an average of the lsks and lckc relative labor demand curves
A country is endowed with a fixed relative supply of labor ˉLK

Relative Factor Uses and Relative Factor Prices
A country's economy-wide relative demand for labor is an average of the lsks and lckc relative labor demand curves
A country is endowed with a fixed relative supply of labor ˉLK
Intersection of relative supply and relative demand sets country’s relative wage rate wr

Different Relative Factor Endowments in Autarky
Home

Foreign

- Foreign relatively more labor-abundant than Home (ˉLˉK)H<(ˉLˉK)F
- Thus, Foreign has a lower relative price of labor than Home (wr)H>(wr)F
- Hence, Foreign has a comparative advantage in making shoes; Home in computers
Running Our Two Country Example
Our Two Country Trade Example: Autarky
Home

Foreign

- Countries begin in autarky optimum with different relative prices
- A is optimum for Home
- A' is optimum for Foreign
Our Two Country Trade Example: Specialization
Home

Foreign

- Home has comparative advantage in computers
- Foreign has comparative advantage in shoes
Our Two Country Trade Example: Specialization
Home

Foreign

- Countries specialize: produce more of comparative advantaged good, less of disadvantaged good
- Home: A → B: produces more computers, fewer shoes
- Foreign: A' → B': produces fewer computers, more shoes
Our Two Country Trade Example: Exports
Home

Foreign

- Home exports computers
- Foreign exports shoes
Our Two Country Trade Example: Imports
Home

Foreign

- Home imports shoes
- Foreign imports computers
Our Two Country Trade Example: Gains from Trade
Home

Foreign

Both countries exchange their imports & exports and consume at C and C'
Both reach a higher indifference curve with trade, well beyond their PPFs!
Factor Price Equalization
Relative Price Changes in Home
Let's look at Home
Increase in the relative price of computers from trade
- decrease in relative price of shoes

Relative Factor Price Changes in Home
Fixed relative labor supply ˉLK
Decrease in relative labor demand
- More demand for capital (for computers)
- Less demand for labor (for shoes)
Lowers relative wages wr

Relative Price Changes in Foreign
Let's look at Foreign
Increase in the relative price of shoes from trade
- decrease in relative price of computers

Relative Factor Price Changes in Foreign
Fixed relative labor supply ˉL′K′
Increase in relative labor demand
- More demand for labor (for shoes)
- Less demand for capital (for computers)
Raises relative wages wr

Factor Price Equalization
Home

Foreign

- Relative factor prices equalize across both countries (at w2/r2)
- Home: ↓ wages w, ↑ capital returns r
- Foreign: ↑ wages w, ↓ capital returns r
Factor Price Equalization Theorem
- Factor Price Equalization (FPE) Theorem: under certain conditions, international trade tends to bring about equalization in relative and absolute returns to homogeneous factors across nations

Long Run Real Income Changes (Stolper-Samuelson)
Long-Run Real Income Changes: Home
Real income changes at Home in the long-run, when both L and K are mobile:
- implies factor returns (w and r) must (each) equalize across industries (s and c)
Increase in the relative price of computers (fall in relative price in shoes) ⟹ fall in relative price of labor wr (rise in relative price of capital)
This implies both industries will use relatively more labor (cheaper) and less capital (more expensive)

Long-Run Real Income Changes: Home
Using more labor, less capital, in both industries:
Change in real wages: pc∗MPLc=w=ps∗MPLs
- ↓MPLc=wpc & ↓MPLs=wps
- Real wages fall
Change in real income to capital: pc∗MPKc=r=ps∗MPKs
- ↑MPKc=rpc & ↑MPKs=rps
- Real return to capital rises

Long-Run Real Income Changes: Foreign
Real income changes at Foreign in the long-run, when both L and K are mobile:
- implies factor returns (w and r) must (each) equalize across industries (s and c)
Increase in the relative price of shoes (fall in relative price in computers) ⟹ rise in relative price of labor wr (fall in relative price of capital)
This implies both industries will use relatively less labor (more expensive) and more capital (cheaper)

Long-Run Real Income Changes: Home
Using less labor, more capital, in both industries:
Change in real wages: pc∗MPLc=w=ps∗MPLs
- ↑MPLc=wpc & ↑MPLs=wps
- Real wages rise
Change in real income to capital: pc∗MPKc=r=ps∗MPKs
- ↓MPKc=rpc & ↓MPKs=rps
- Real return to capital falls

Stolper-Samuelson Theorem
- Stolper-Samuelson Theorem: in the long run, an increase in the relative price of a good will increase the real earnings of the factor used intensively in that good’s production and decrease the earnings of the other factor

