2.1 — Tariffs
ECON 324 • International Trade • Fall 2020
Ryan Safner
Assistant Professor of Economics
safner@hood.edu
ryansafner/tradeF20
tradeF20.classes.ryansafner.com
Tariffs
Tariffs, According to the President of the United States
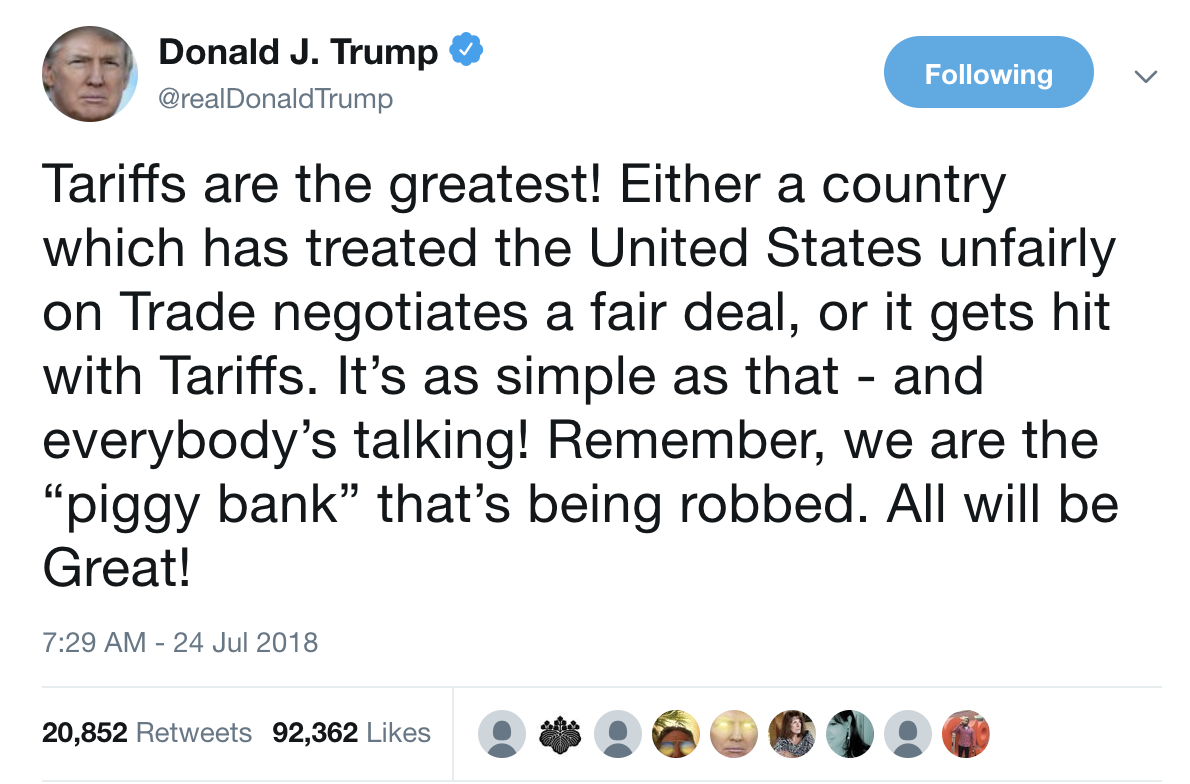
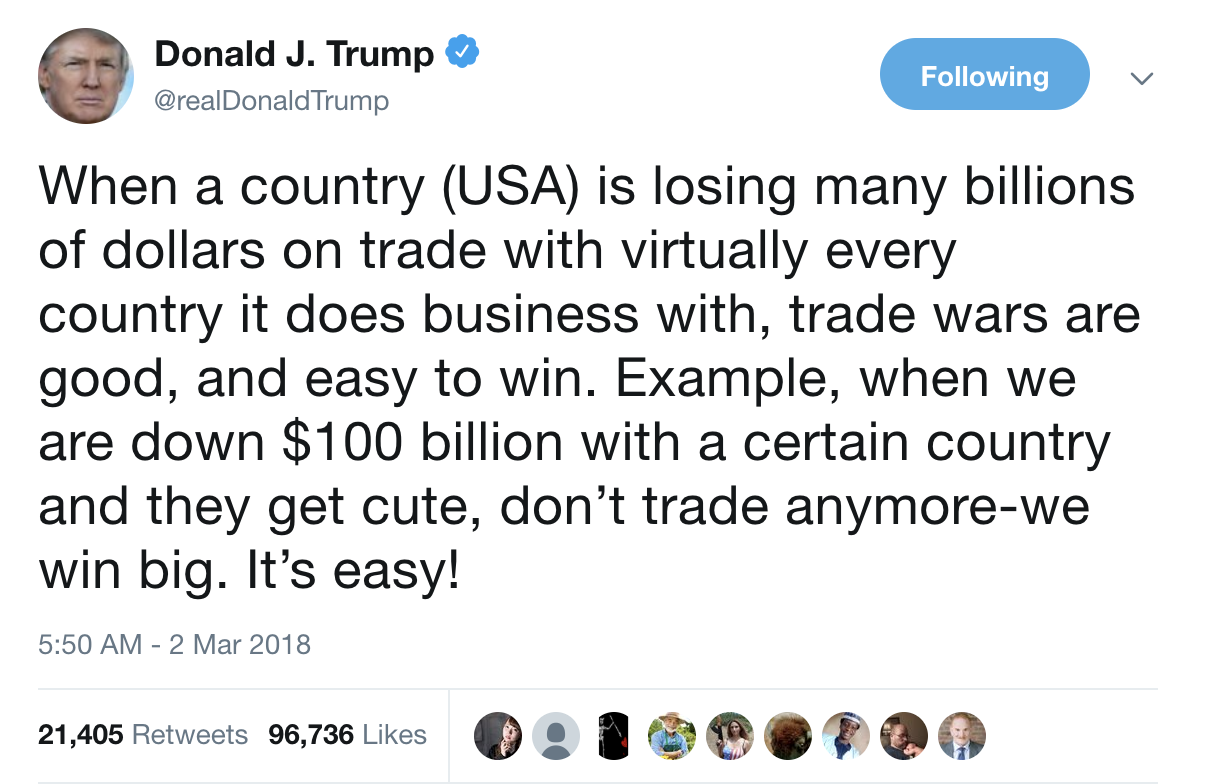
International Trade Policies
Economists generally agree that free trade best enhances overall social welfare
Yet free trade is rare in the world
Two questions:
- Why is free trade rare? Or, why are trade restrictions common?
- What are the consequences of restricting trade?
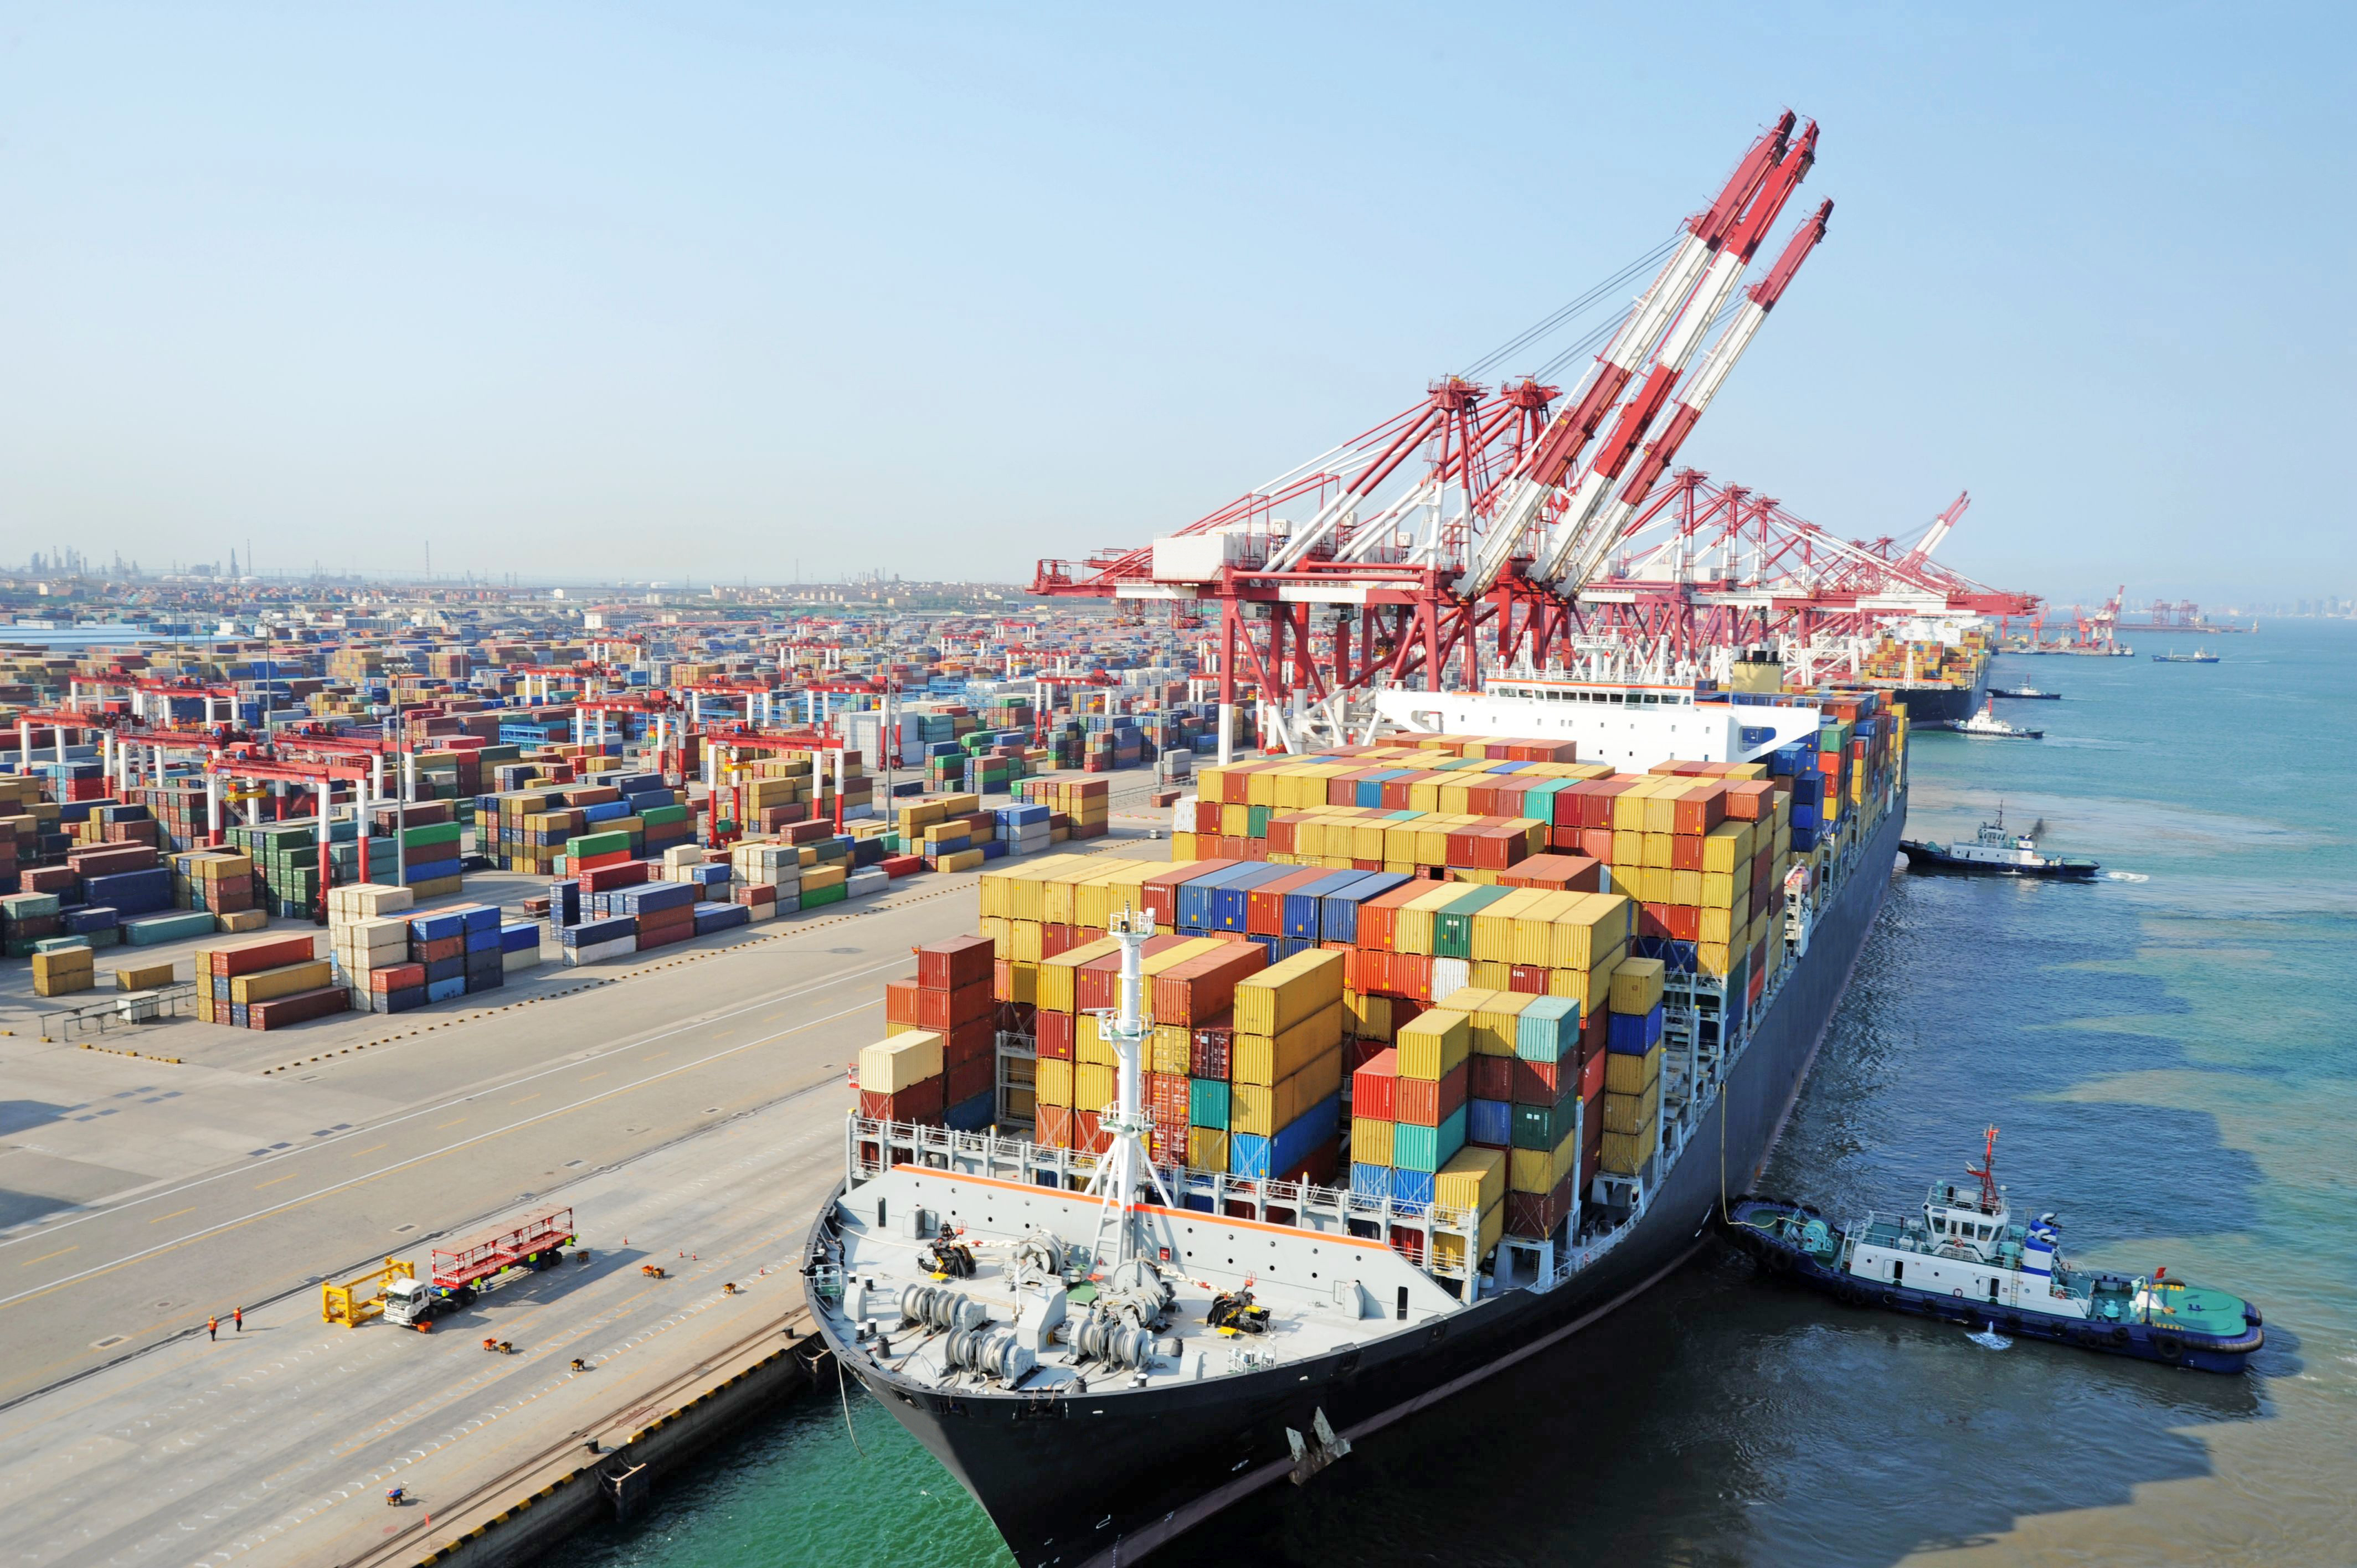
International Trade Policies
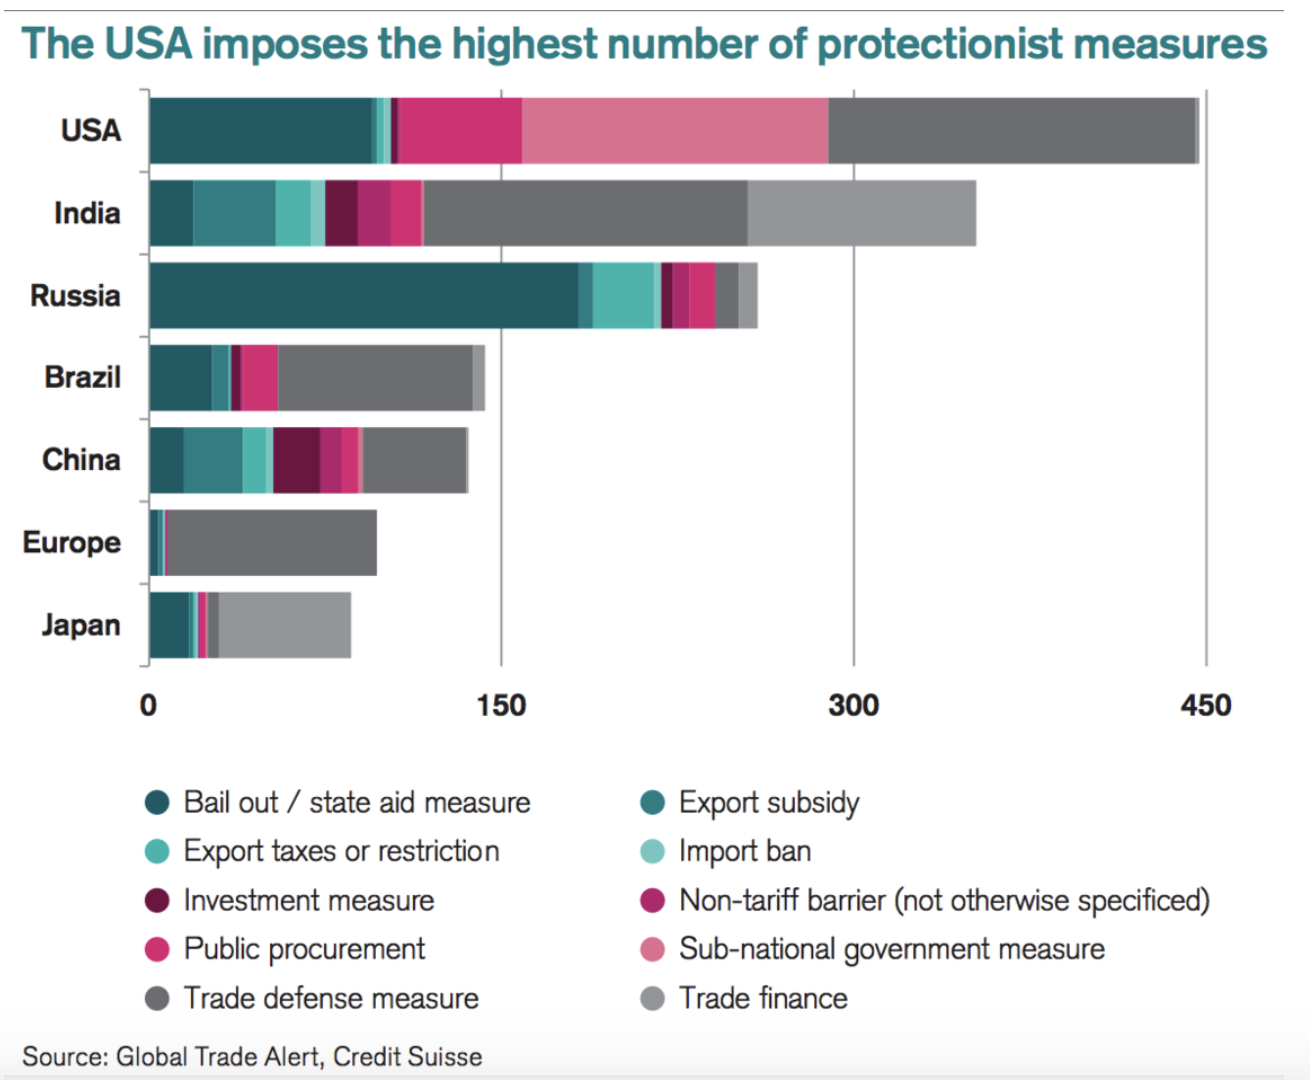
This was in 2015, before the Trump Administration!
Tariffs
Tariffs
Most common way to restrict trade is through a tariff (historically called a “duty”), a tax specifically targeted towards internationally-traded goods
Import tariff: tax on imported goods
- This is by far the most common type of trade restriction
Export tariff: tax on exported goods
- Rare in developed countries but sometimes occurs in developing countries as a way to generate government revenue

Types of Tariffs
Ad valorem tariff taxes a fixed percentage of the value of a good
- e.g. 25% U.S. tariff on (prices of) imported trucks
Specific tariff taxes a fixed sum per unit of a good
- e.g. $3/barrel of oil
Compound tariff combines ad valorem and specific tariffs
- Rare in developed countries but sometimes occurs in developing countries as a way to generate government revenue

Tariff Schedule
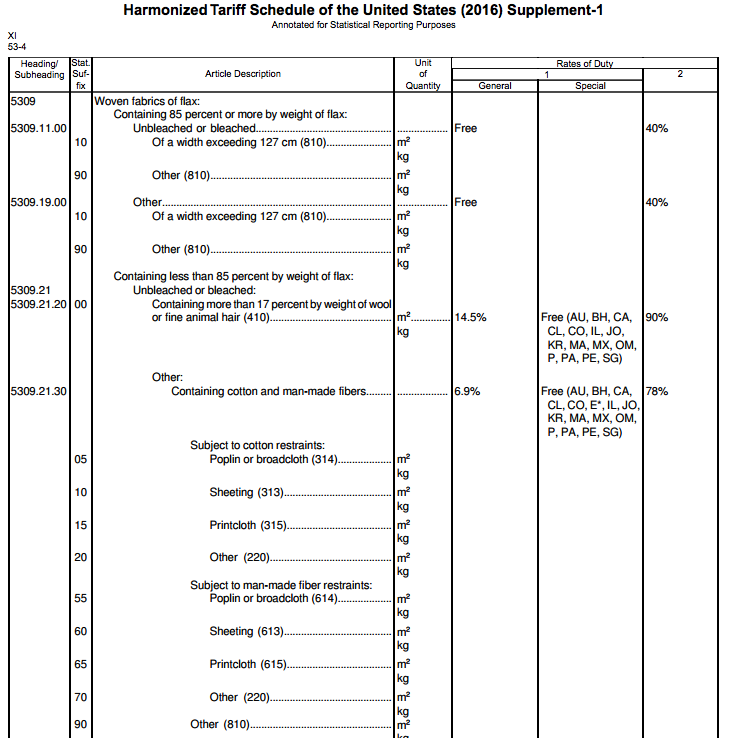
U.S. tariff schedule on imported woven flax fabrics, Harmonized Tariff Schedule, United States International Trade Commission Chapter 53, p. 53-4
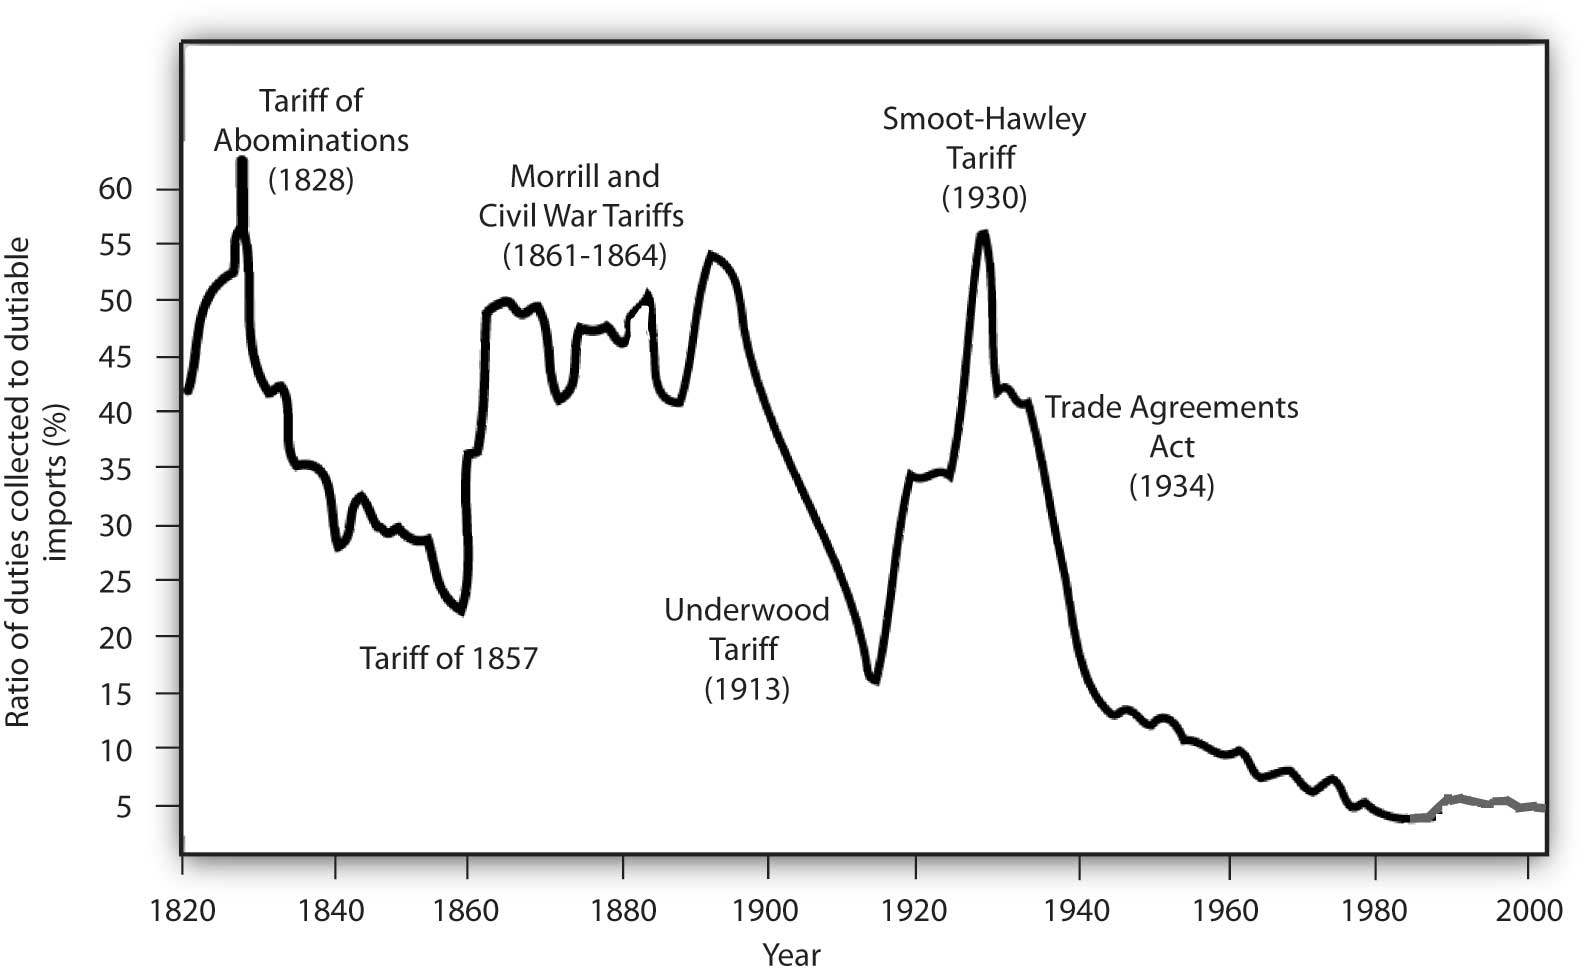
Tariff History
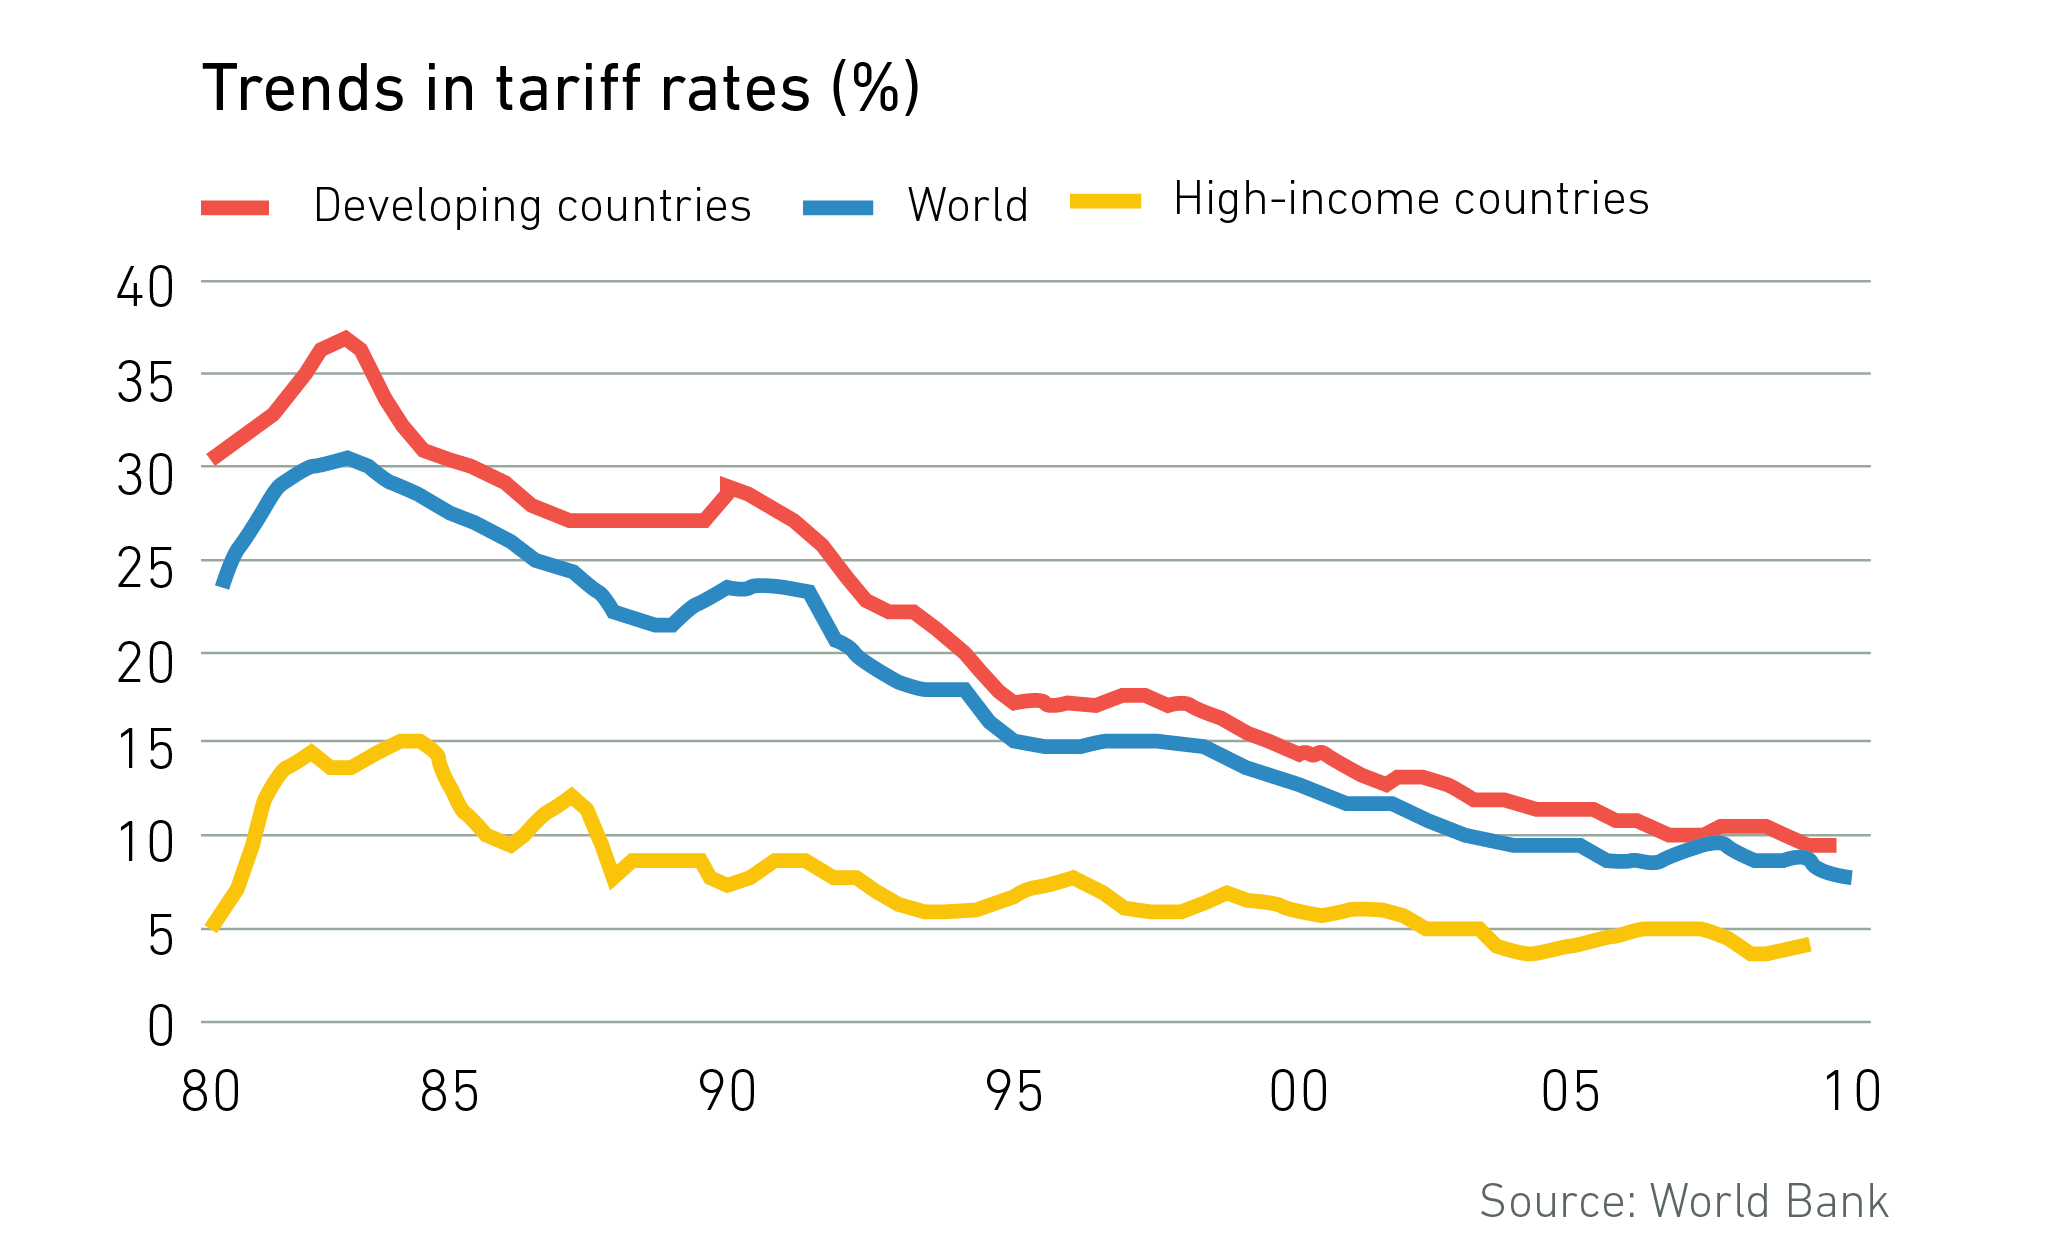
Tariff History
Effects of an Import Tariff in a Small Country
Import Tariff Effects in a Small Country
- To analyze effects of a tariff (on imports), need to compare two cases:
Effect of a tariff in a “small” country
- “Small” ⟹ its domestic market is too small to affect world prices
- Effectively, it is a price-taker: it can import as much as it wants and not drive up the price
Effect of a tariff in a “large” nation
- “Large” ⟹ changes in the country’s domestic market can affect world prices

Import Tariff Effects in a Small Country
- Consider, for example, the sugar market in Belgium

Import Tariff Effects in a Small Country
Consider, for example, the sugar market in Belgium
Domestic Demand for sugar in Belgium

Import Tariff Effects in a Small Country
Consider, for example, the sugar market in Belgium
Domestic Demand for sugar in Belgium
Domestic Supply of sugar in Belgium

Import Tariff Effects in a Small Country
Consider, for example, the sugar market in Belgium
Domestic Demand for sugar in Belgium
Domestic Supply of sugar in Belgium
Autarky price: 10¢/lb, 10 billion lbs exchanged within Belgium

Import Tariff Effects in a Small Country
Consider, for example, the sugar market in Belgium
Domestic Demand for sugar in Belgium
- Consumer surplus = WTP - p*
Domestic Supply of sugar in Belgium
Autarky price: 10¢/lb, 10 billion lbs exchanged within Belgium

Import Tariff Effects in a Small Country
Consider, for example, the sugar market in Belgium
Domestic Demand for sugar in Belgium
- Consumer surplus = WTP - p*
- = 0.5(10-0)($0.20-$0.10) = $0.5 billion
Domestic Supply of sugar in Belgium
Autarky price: 10¢/lb, 10 billion lbs exchanged within Belgium

Import Tariff Effects in a Small Country
Consider, for example, the sugar market in Belgium
Domestic Demand for sugar in Belgium
- Consumer surplus = WTP - p*
- = 0.5(10-0)($0.20-$0.10) = $0.5 billion
Domestic Supply of sugar in Belgium
- Producer surplus = p* - WTA
Autarky price: 10¢/lb, 10 billion lbs exchanged within Belgium

Import Tariff Effects in a Small Country
Consider, for example, the sugar market in Belgium
Domestic Demand for sugar in Belgium
- Consumer surplus = WTP - p*
- = 0.5(10-0)($0.20-$0.10) = $0.5 billion
Domestic Supply of sugar in Belgium
- Producer surplus = p* - WTA
- = 0.5(10-0)($0.10-$0.00) = $0.5 billion
Autarky price: 10¢/lb, 10 billion lbs exchanged within Belgium

Import Tariff Effects in a Small Country
Consider, for example, the sugar market in Belgium
Domestic Demand for sugar in Belgium
Domestic Supply of sugar in Belgium
Suppose Belgium opens up to international trade
World Supply of sugar at 4¢/lb

Import Tariff Effects in a Small Country
- At 4¢/lb:
- Belgian consumers want to consume 16 bn lbs

Import Tariff Effects in a Small Country
- At 4¢/lb:
- Belgian consumers want to consume 16 bn lbs
- Belgian producers will produce 4 bn lbs

Import Tariff Effects in a Small Country
- At 4¢/lb:
- Belgian consumers want to consume 16 bn lbs
- Belgian producers will produce 4 bn lbs
- Belgium will import 12 bn lbs from the rest of the world

Import Tariff Effects in a Small Country
Under international trade:
Consumer surplus = WTP - p*
- = 0.5(16-0)($0.20-$0.04) = $1.280 billion

Import Tariff Effects in a Small Country
Under international trade:
Consumer surplus = WTP - p*
- = 0.5(16-0)($0.20-$0.04) = $1.280 billion
Producer surplus = p* - WTA
- = 0.5(4-0)($0.04-$0.00) = $0.080 billion

Import Tariff Effects in a Small Country
Under international trade:
Consumer surplus = WTP - p*
- = 0.5(16-0)($0.20-$0.04) = $1.280 billion
Producer surplus = p* - WTA
- = 0.5(4-0)($0.04-$0.00) = $0.080 billion
Trade benefits Belgian consumers at expense of Belgian sugar producers
- But gain is much bigger than loss!

Import Tariff Effects in a Small Country


We can trace Belgium’s import demand from the world based on the world price
Note at a price of ¢10 there is no import demand, all sugar can be produced in Belgium
Import Tariff Effects in a Small Country


We can trace Belgium’s import demand from the world based on the world price
Note at a price of ¢10 there is no import demand, all sugar can be produced in Belgium
We have been assuming the world supply of sugar is perfectly elastic at 4¢
Sets equilibrium amount of imports in Belgium, 12 bn lbs imported
Import Tariff Effects in a Small Country
- Suppose the government levies a 4¢/lb tariff on sugar imports

Import Tariff Effects in a Small Country
Suppose the government levies a 4¢/lb tariff on sugar imports
At new domestic sugar price of 8¢/lb

Import Tariff Effects in a Small Country
Suppose the government levies a 4¢/lb tariff on sugar imports
At new domestic sugar price of 8¢/lb
- Belgian consumers want to consume 12 bn lbs (less than before)

Import Tariff Effects in a Small Country
Suppose the government levies a 4¢/lb tariff on sugar imports
At new domestic sugar price of 8¢/lb
- Belgian consumers want to consume 12 bn lbs (less than before)
- Belgian producers will produce 8 bn lbs (more than before)

Import Tariff Effects in a Small Country
Suppose the government levies a 4¢/lb tariff on sugar imports
At new domestic sugar price of 8¢/lb
- Belgian consumers want to consume 12 bn lbs (less than before)
- Belgian producers will produce 8 bn lbs (more than before)
- Belgium will import 4 bn lbs from the rest of the world (less than before)
Tariff is a tax, so government earns revenue:
- 4 bn lbs $\times $ 0.04/lb = $0.160 bn

Import Tariff Effects in a Small Country
Under the tariff:
Consumer surplus = WTP - p*
- = 0.5(12-0)($0.20-$0.08) = $0.720 billion
- Less than before (free trade)

Import Tariff Effects in a Small Country
Under the tariff:
Consumer surplus = WTP - p*
- = 0.5(12-0)($0.20-$0.08) = $0.720 billion
- Less than before (free trade)
Producer surplus = p* - WTA
- = 0.5(8-0)($0.08-$0.00) = $0.320 billion
- More than before (free trade)

Import Tariff Effects in a Small Country
Under the tariff:
Two new sources of market inefficiency created, “deadweight loss (DWL)”

Import Tariff Effects in a Small Country
Under the tariff:
Two new sources of market inefficiency created, “deadweight loss (DWL)”
- Inefficient domestic production (cheaper for foreigners to produce sugar)
- 0.5(8-4)($0.08-$0.04) = $0.080 Billion

Import Tariff Effects in a Small Country
Under the tariff:
Two new sources of market inefficiency created, “deadweight loss (DWL)”
- Inefficient domestic production (cheaper for foreigners to produce sugar)
- 0.5(8-4)($0.08-$0.04) = $0.080 Billion
- Lost gains from exchange (consumers wanted to buy more from world)
- 0.5(16-12)($0.08-$0.04) = $0.080 Billion

Import Tariff Effects in a Small Country


Can also see this in the import market
Decline of imports at higher price in Belgium
Size of DWL in import market = sum of both DWL triangles in Belgian market ($0.160 bn)
Import Tariff Effects in a Small Country
- Domestic consequences of tariff:
Decrease in consumer surplus:
- $0.720 bn-$1.280 bn = -$0.460 bn
Increase in producer surplus:
- $0.320 bn-$0.080 bn = $0.240 bn
Government tax revenue:
- $0.160 bn
Deadweight losses
- $-0.080 bn - $0.080 bn = -$0.160 bn

Import Tariff Effects in a Small Country
Domestic consequences of tariff:
A $240m gain to a small group of domestic sugar producers at a $460m expense to consumers
Concentrated benefit, dispersed cost each consumer pays $0.04/lb more for sugar
Harm to foreigners: hurts exporters and consumers in other countries from lost trade

Tariff Effects in a Large Country
Large Countries in International Trade
A “large country” has a sufficiently large domestic demand to affect international prices
The decrease in domestic demand from an import tariff (from higher import price) is sufficiently large to lower the world price of the good
This is called the “terms of trade effect” of a tariff
- can provide a benefit to domestic country
- harms foreign exporters due to lower world price

Import Tariff Effects in a Large Country
Consider, for example, the sugar market in the U.S.
Autarky price: 10¢/lb, 10 billion lbs exchanged within U.S.

Import Tariff Effects in a Large Country
Suppose U.S. opens up to international trade
World Supply of sugar at 4¢/lb:

Import Tariff Effects in a Large Country
Suppose U.S. opens up to international trade
World Supply of sugar at 4¢/lb:
- U.S. consumers want to consume 16 bn lbs
- U.S. producers will produce 4 bn lbs
- U.S. will import 12 bn lbs from the rest of the world

Import Tariff Effects in a Large Country


We can trace U.S.’s import demand from the world based on the world price
Because U.S. is a large country, the world supply curve (exports from other countries) to U.S. is upward sloping
- sufficiently high demand from U.S. stimulates production abroad for export to U.S.
Imagine autarky equilibrium price in exporting countries is 2¢; once they can get higher price in U.S., start exporting
Sets equilibrium amount of imports in U.S., 12 bn lbs imported at 4¢
Import Tariff Effects in a Large Country
Now suppose U.S. imposes a 4¢/lb tariff on imported sugar
Increase in costs to world sugar exporters decreases world export supply by 4¢/lb
New equilibrium is for U.S. to import 6 bn lbs at 7¢/lb
- But 4¢/lb of the imports are paid to U.S. government as tariffs
Exporters to U.S. recieve net price (after taxes) of 3¢/lb
Important: raise in price to U.S. consumers is less than the full 4¢/lb!
- Tariff on the massive U.S. market has lowered the world price of sugar because of decreased world supply, the terms of trade effect

Import Tariff Effects in a Large Country
Now suppose U.S. imposes a 4¢/lb tariff on imported sugar
Due to the terms of trade effect, world price of sugar will fall from less U.S. demand (to 3¢/lb)

Import Tariff Effects in a Large Country
Now suppose U.S. imposes a 4¢/lb tariff on imported sugar
Due to the terms of trade effect, world price of sugar will fall from less U.S. demand (to 3¢/lb)
The 4¢/lb is levied on this new, lower world price of sugar, raising price of sugar in U.S. to 7¢/lb

Import Tariff Effects in a Large Country
- At new domestic price of 7¢/lb:
- U.S. consumers want to consume 13 bn lbs (less than before)

Import Tariff Effects in a Large Country
- At new domestic price of 7¢/lb:
- U.S. consumers want to consume 13 bn lbs (less than before)
- U.S. producers will produce 7 bn lbs (more than before)

Import Tariff Effects in a Large Country
At new domestic price of 7¢/lb:
- U.S. consumers want to consume 13 bn lbs (less than before)
- U.S. producers will produce 7 bn lbs (more than before)
- U.S. will import 6 bn lbs from rest of the world (less than before)
Note the changes are not as much as it was to the small country
- U.S. “market power” forces down world price

Import Tariff Effects in a Large Country
Loss to U.S. consumer surplus (but less than for small country)
Gain to U.S. producer surplus (but less than for small country)
- Transfer of CS to PS

Import Tariff Effects in a Large Country
- Tariff will collect revenue for government
- 4¢/lb × 6 bn lbs = $0.240 bn

Import Tariff Effects in a Large Country
Tariff will collect revenue for government
- 4¢/lb × 6 bn lbs = $0.240 bn
DWLs from productive and consumption inefficiencies
- 2 × $-0.045 bn = -$0.090 bn

Import Tariff Effects in a Large Country
Tariff will collect revenue for government
- 4¢/lb × 6 bn lbs = $0.240 bn
DWLs from productive and consumption inefficiencies
- 2 × $-0.045 bn = -$0.090 bn
But: gain in tariff revenue exceeds inefficiency (DWL)!
- Tariff brings a net increase in U.S. national welfare!

Import Tariff Effects in a Large Country


Area D is the Terms of trade gain for U.S. (loss to world) due to tariff
U.S. deadweight loss (A+B) < U.S. tariff revenue (C+D)
Foreign loses deadweight loss (F) from lost export opportunities
Import Tariff Effects in a Large Country


Welfare changes:
- To US: (C+D)-(A+B), net gain!
- To Rest of World: -(D+E), net loss
- Whole World: C-(A+B+E), net loss
A “beggar thy neighbor” approach to increasing national welfare
Big vs. Small Comparisons
Both countries start out with same world price, imports, domestic demand and supply
With free trade:
| Country | p∗ | q∗ | Domestic q | Imports | CS | PS | Tax Revenue | DWL |
|---|---|---|---|---|---|---|---|---|
| Small (Belgium) | $0.04 | 16 bn | 4 bn | 12 bn | $1.280 bn | $0.080 bn | $0 | $0 |
| Large (U.S.) | $0.04 | 16 bn | 4 bn | 12 bn | $1.280 bn | $0.080 bn | $0 | $0 |
- With same 4¢ tariff on imports:
| Country | p∗ | q∗ | Domestic q | Imports | Δ CS | Δ PS | Tax Revenue | DWL |
|---|---|---|---|---|---|---|---|---|
| Small (Belgium) | $0.08 | 12 bn | 8 bn | 4 bn | -$0.560 bn | $0.240 bn | $0.160 bn | -$0.160 bn |
| Large (U.S.) | $0.07 | 13 bn | 7 bn | 6 bn | -$0.435 bn | $0.035 bn | $0.240 bn | -$0.090 bn |
Optimal Tariff Theory
Optimal Tariff Theory
For a large country, a tariff decreases volume of trade but improves country’s terms of trade
- Gain of tariff revenue (C+D)
- Loss of deadweight loss (A+B)
Net effect is a slight increase in (big) country’s welfare
- Note tariffs always are a net harm to a small nation!
Thus, there exists some optimal tariff τ>0 that maximizes net gains from tradeoff between terms of trade improvements against decline in trade

Optimal Tariff Theory (in a Large Country)
τ=0: free trade
For low levels of τ, terms of trade gain exceed deadweight loss
- (C+D) > (A+B)
For high levels of τ, deadweight loss exceeds terms of trade gain
- (C+D) < (A+B)
Extremely high levels of τ will close off trade completely
Some optimal τ⋆ that maximizes welfare gain to importer

Optimal Tariff Theory vs. the Real World
Economic theory shows the theoretical possibility of how tariffs might increase national welfare
Regardless, tariffs harm welfare of trading partners (exporting countries)
Politically and practically, trading partners might retaliate against tariffs with their own tariffs
- Might degenerate into a trade war where potential gains from trade are lost

The Effective Rate of Protection
The Effective Rate of Protection
How much do tariffs protect domestic industry?
Seems logical to just count the percent an ad valorem tariff raises price over free trade price
- This is the nominal rate of protection: the % increase in price
- e.g. a 50% ad valorem tariff raises price 50%
- for specific tariffs, divide price with tariffprice without tariff

The Effective Rate of Protection
- Two problems with nominal rate of protection:
If the country is “large”, part of the tariff’s effect will be to lower foreign export prices rather than just raise domestic prices
Tariffs may have different effects on different stages of production for a good

The Effective Rate of Protection
Better to think about the effective rate of protection as the percent change in domestic value added
Example: Suppose cars sell on world market for $8,000, and car parts sell for $6,000. If a country buys car parts and assembles them into cars, the domestic value added is: $8,000−$6,000=$2,000


The Effective Rate of Protection: Example
Suppose Home wants to develop a domestic auto assembly industry
- Domestic value added from imports is:
$8,000−$6,000=$2,000
- Domestic value added from imports is:
$8,000−$6,000=$2,000
Home places a 25% tariff on imported cars, raising the price of cars in Home to $10,000
- Domestic value added from imports is:
$10,000−$6,000=$4,000
- Domestic value added from imports is:
$10,000−$6,000=$4,000
Domestic value added changes by: $4,000−$2,000$2,000×100=100%

The Effective Rate of Protection: Example
Suppose Home instead wants to develop a domestic car parts industry
- Domestic value added from imports is:
$8,000−$6,000=$2,000
- Domestic value added from imports is:
$8,000−$6,000=$2,000
Home places a 25% tariff on imported car parts, raising the price of car parts in Home to $7,500
- Domestic value added for car parts manufacturers is:
$$7,500
- Domestic value added for car parts manufacturers is:
$$7,500
- Changes by:
$7,500−$6,000$6,000×100

The Effective Rate of Protection: Example
Suppose Home instead wants to develop a domestic car parts industry
- Domestic value added from imports is:
$8,000−$6,000=$2,000
- Domestic value added from imports is:
$8,000−$6,000=$2,000
What about for assemblers of cars?
- Domestic value added for car assemblers is:
$8,000−$7,500=$500
- Domestic value added for car assemblers is:
$8,000−$7,500=$500
- Changes by:
$500−$2,000$2,000×100

The Effective Rate of Protection: Example
We can see that the structure of tariffs often impact different stages of the production process differently
Here, a tariff on car parts gave 25% more protection to domestic car parts producers, at the expense of a 75% loss to domestic car assemblers

The Effective Rate of Protection
In general, we see that effective rate of protection ≠ nominal tariff rate
- May be higher or lower, or even negative
Tariffs on foreign inputs generate negative effective rates of protection, and tariffs on final products generate positive eeffective rates of protection for a country’s domestic industry

